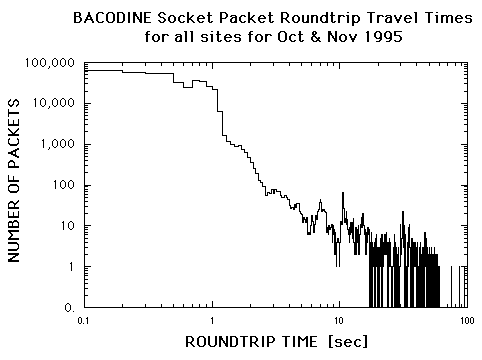

Fig 1. The above figure is a histogram of the roundtrip travel times for the Imalive (type=3) packets for all socket sites during the months of October and November 1995. A Log-Log plot was used to show both the large concentration of packet times at short times, and the structure of the tail of the distribution. There are 433,000 packet times in this histogram. The multiple peak structures arise from the different sites around the world. It is probably safe to assume that GSFC-to-site (one way) distribution time is one half of these roundtrip times. Since distribution time is a critical performance specification for GCN/TAN, it is monitored daily (especially for any increase in the percentage in the tail). This plot is very typical.

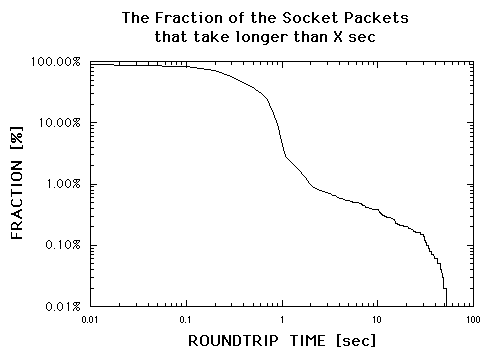
Fig 2. The above figure is an integration of Figure 1 and convertion into a percentage. The percentage of packets that take longer than 2 sec roundtrip is less than 1% for all packets (and less than 0.1% for sites within the US).
The GCN/TAN contact is: Scott Barthelmy,
scott@lheamail.gsfc.nasa.gov,
(301)-286-3106
This file was last modified on 21-May-96.