batgrbproduct analysis for trigger=866993
batgrbproduct Analysis for Trigger=866993
Analysis Summary
Notes:
- 1) No attempt has been made to eliminate the non-significant decimal places.
- 2) This batgrbproduct analysis is done of the amount of data for this trigger downloaded to date.
- 3) This batgrbproduct analysis is using the flight position for the mask-weighting calculation.
- 4) This page will be updated for up to 15 downlinks after the trigger.
======================================================================
                  BAT GRB EVENT DATA PROCESSING REPORT
    Process Script Ver: batgrbproduct v2.46
    Process Start Time (local time): Mon Oct 15 08:18:15 EDT 2018
             Host Name: bat1
   Current Working Dir: /local/data/bat1/prebascript/trigger866993/GCN5_download_cron
======================================================================

  Trigger: 00866993      Segment: 000

  BAT Trigger Time: 561197756.668   [s; MET]
      Trigger Stop: 561197756.732   [s; MET]
               UTC: 2018-10-14T08:15:34.916700    [includes UTCF correction]
       Where From?: (*SHORT BURST*) TDRSS scaled map message

  BAT
    RA: 272.166007718439   Dec: -20.380370164253  [deg; J2000]

     Catalogged Source?: YES
     Point Source?:      YES
     GRB Indicated?:     NO    [ by BAT flight software ]
     Image S/N Ratio:    6.92
     Image Trigger?:     NO
     Rate S/N Ratio:     18.3847763108502  [ if not an image trigger ]
     Image S/N Ratio:    6.92

  Flight Position:   [ source = BAT ]
    RA: 272.166007718439   Dec: -20.380370164253  [deg; J2000]

  Ground Position:   [ source = BAT pre-slew burst ]
    RA: 272.153116847413   Dec: -20.4069110844602  [deg; J2000]
        { 18h 08m 36.7s , -20d 24' 24.9" }
         +/- 1.5533874228864 [arcmin] (estimated 90% radius based on SNR)
         +/- 0.569575055151348 [arcmin] (formal 1-sigma fit error)
    SNR: 16.2129313929944

  Angular difference between Flight and Ground position is 1.749714 arcmin

  Partial Coding Fraction: 0.3125    [ including projection effects ]

  Duration
     T90: 1.90400004386902 +/- 0.365557208133314
        Measured from: -0.0679998397827148
                   to: 1.8360002040863     [s; relative to TRIGTIME]
     T50: 0.927999973297119 +/- 0.192665487917238
        Measured from: 0.124000191688538
                   to: 1.05200016498566     [s; relative to TRIGTIME]


  Fluence
     Peak Flux  (peak 1 second)
        Measured from: -0.175999999046326
                   to: 0.824000000953674     [s; relative to TRIGTIME]
     Total Fluence
        Measured from: -0.195999979972839
                   to: 2.0440000295639     [s; relative to TRIGTIME]

             Band 1     Band 2     Band 3     Band 4
              15-25      25-50     50-100    100-350     keV
 Total     0.316368   0.329771   0.078690   0.016439
           0.025073   0.024657   0.017661   0.013318 [error]
 Peak      0.232020   0.210452   0.043677   0.003027
           0.018905   0.018104   0.012434   0.009066 [error]

     [ fluence units of on-axis counts / fully illuminated detector ]

======================================================================

=== Fluence/Peak Flux Summary ===

              Model    Band1    Band2    Band3    Band4    Band5    Total
                       15-25    25-50   50-100  100-350   15-150   15-350   keV
Fluence   Power-law 1.13e-07 1.22e-07 9.36e-08 1.17e-07 3.73e-07 4.46e-07   erg/cm2
              Error 1.34e-08 1.19e-08 1.56e-08 3.59e-08 3.94e-08 5.94e-08   erg/cm2
Peak flux Power-law 2.65e+00 1.45e+00 4.96e-01 2.21e-01 4.71e+00 4.82e+00   ph/cm2/s
              Error 3.43e-01 1.58e-01 9.48e-02 7.43e-02 4.95e-01 5.03e-01   ph/cm2/s

Fluence   Cutoff-PL 1.00e-07 1.62e-07 6.37e-08 3.27e-09 3.29e-07 3.29e-07   erg/cm2
              Error 1.53e-08 1.82e-08 2.14e-08 5.73e-09 3.54e-08 3.56e-08   erg/cm2
Peak flux Cutoff-PL 2.33e+00 1.86e+00 3.90e-01 1.36e-02 4.60e+00 4.60e+00   ph/cm2/s
              Error 3.95e-01 2.37e-01 1.29e-01 2.37e-02 4.96e-01 4.96e-01   ph/cm2/s

Fluence        Band 9.93e-08 1.61e-07 6.42e-08 8.76e-09 3.32e-07 3.34e-07   erg/cm2
              Error 1.51e-08 -------- -------- 3.37e-08 -------- --------   erg/cm2
Peak flux      Band -------- -------- -------- -------- -------- --------   ph/cm2/s
              Error -------- -------- -------- -------- -------- --------   ph/cm2/s
=== Time-averaged spectral analysis ===

Model Ph_index Ph_90err Epeak  Epeak_90err Norm     Nomr_90err chi2   dof
PL    2.382    0.163    -      -           1.71e-02 2.16e-03   86.170 57
CPL  -0.387    1.162      31.3    3.8      9.29e-01 3.00e+00   60.250 56

The chi2 of BB fit is 63.19 which shows a significant improvement in the fit over a PL.
Check the BB fit.

=== 1-s peak spectral analysis ===

Model Ph_index Ph_90err Epeak  Epeak_90err Norm     Nomr_90err chi2   dof
PL    2.546    0.188    -      -           2.33e-02 3.49e-03   54.280 57
CPL   0.133    1.210      28.2    5.9      7.59e-01 2.68e+00   36.550 56

Model      : spectral model: simple power-law (PL) and cutoff power-law (CPL)
Ph_index   : photon index: E^-{Ph_index} (minus sign is not included in the index)
Ph_90err   : 90% error of the photon index
Epeak      : Epeak in keV
Epeak_90err: 90% error of Epeak
Norm       : normalization at 50 keV in PL model and at 1 keV in CPL model
Nomr_90err : 90% error of the normalization
chi2       : Chi-Squared
dof        : degree of freedom
=== T90/T50 calculation in the 50-300 keV band (BATSE band) using 64 ms lc ===

T90 in the 50-300 keV band: 0.000000 sec.
T50 in the 50-300 keV band: 0.000000 sec.
=== Table of the duration information ==

        Value   tstart    tstop
T100    2.240   -0.196    2.044
T90     1.904   -0.068    1.836
T50     0.928    0.124    1.052
Peak    1.000   -0.176    0.824
Image
Pre-slew 15-350 keV image (Event data; bkg subtracted)
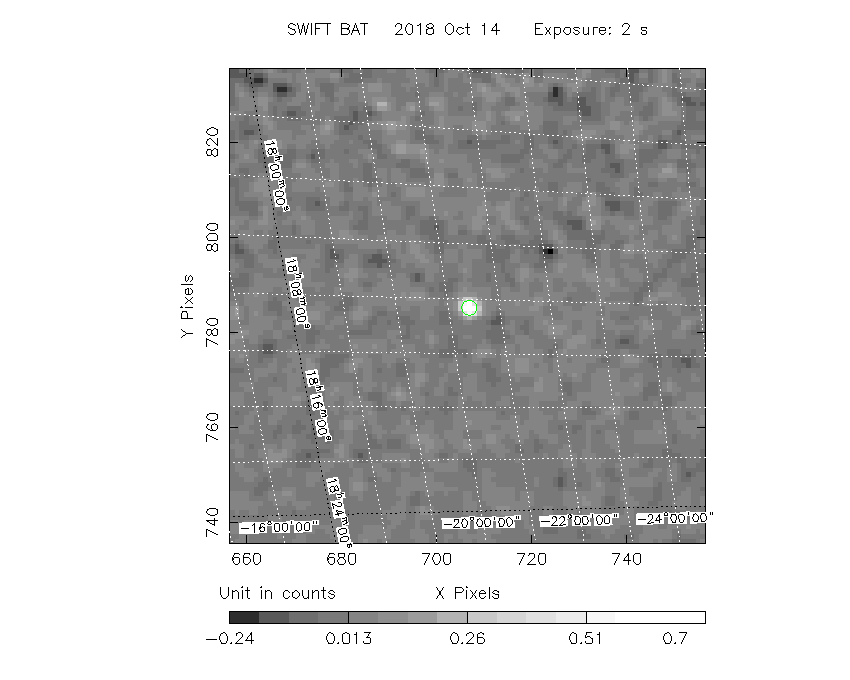
#   RAcent  DECcent POSerr  Theta    Phi     Peak Cts     SNR  Name
  272.1531 -20.4069 0.0119   36.6  -60.8       0.7659    16.2  TRIG_00866993
------------------------------------------

Foreground time interval of the image:
 -0.196   2.044 (delta_t =   2.240 [sec])
Background time interval of the image:
-239.668  -0.196 (delta_t = 239.472 [sec])
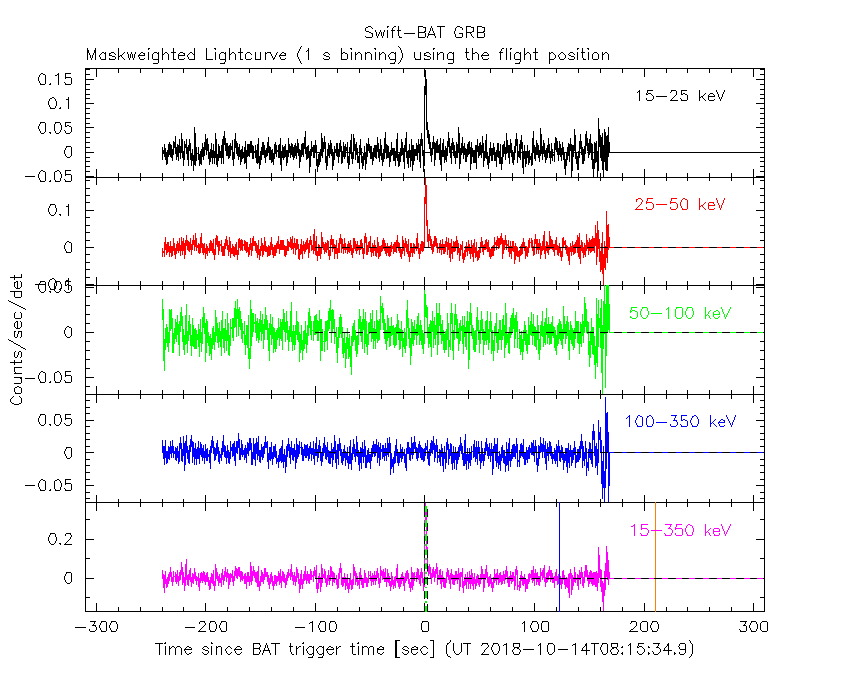
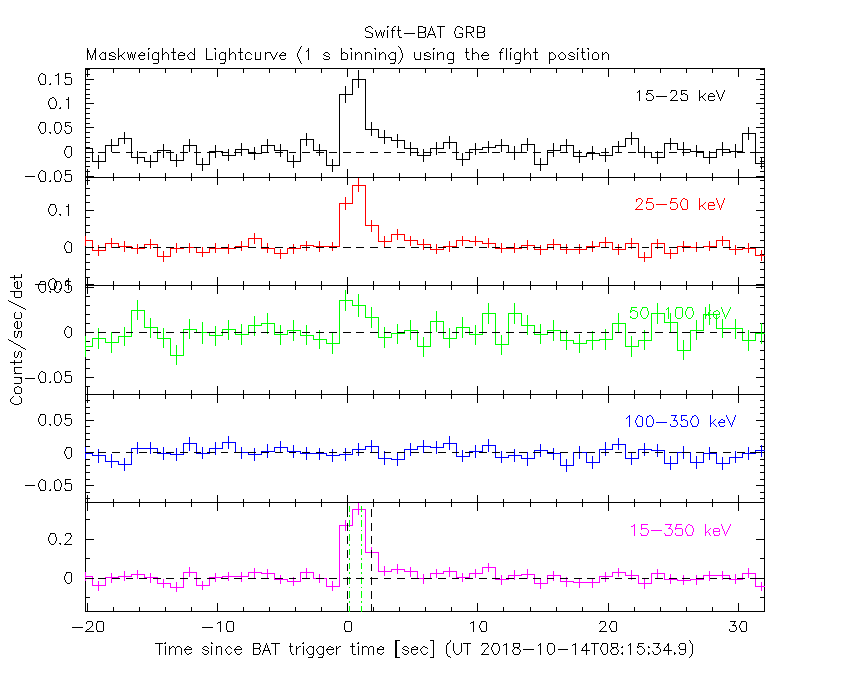
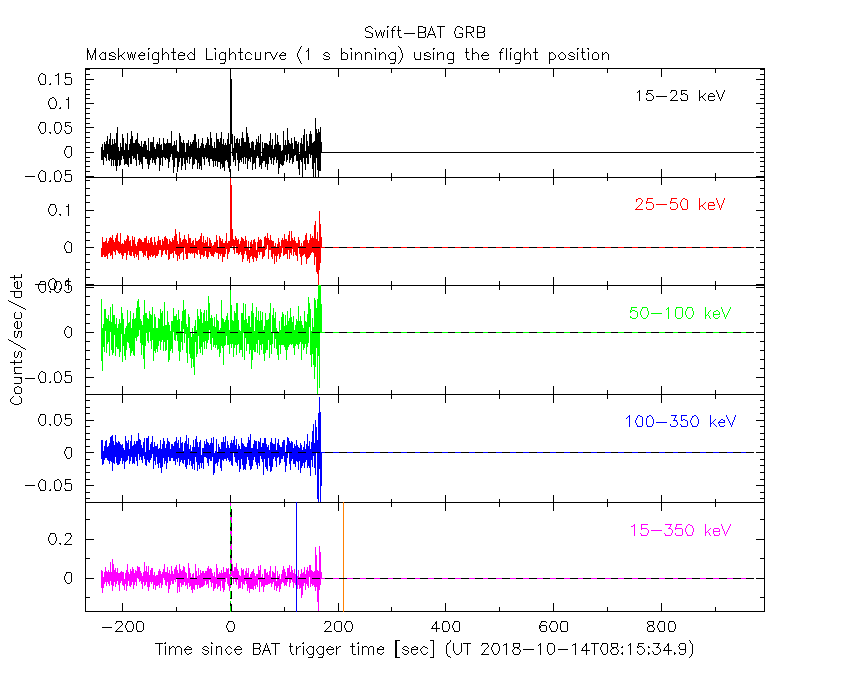
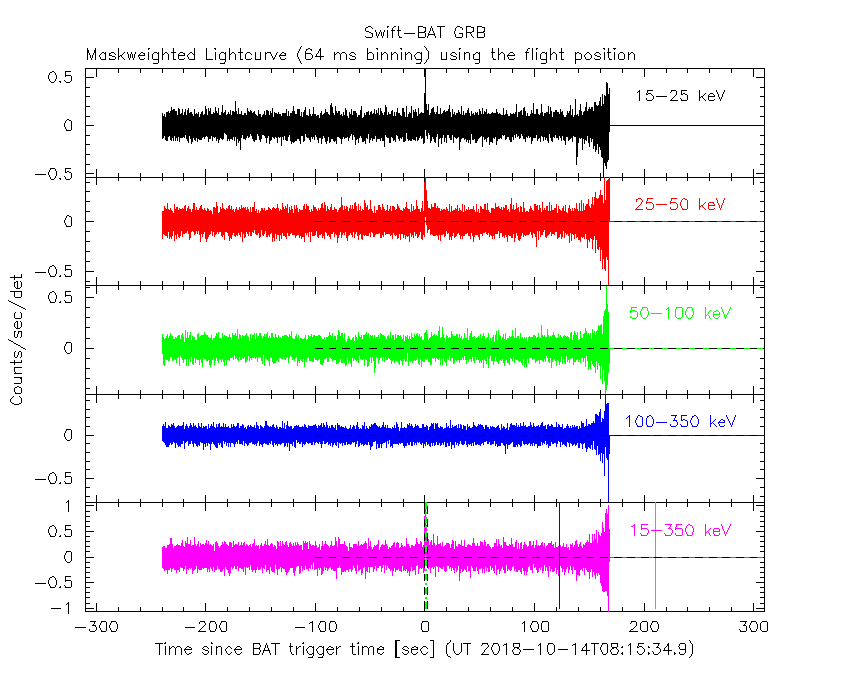
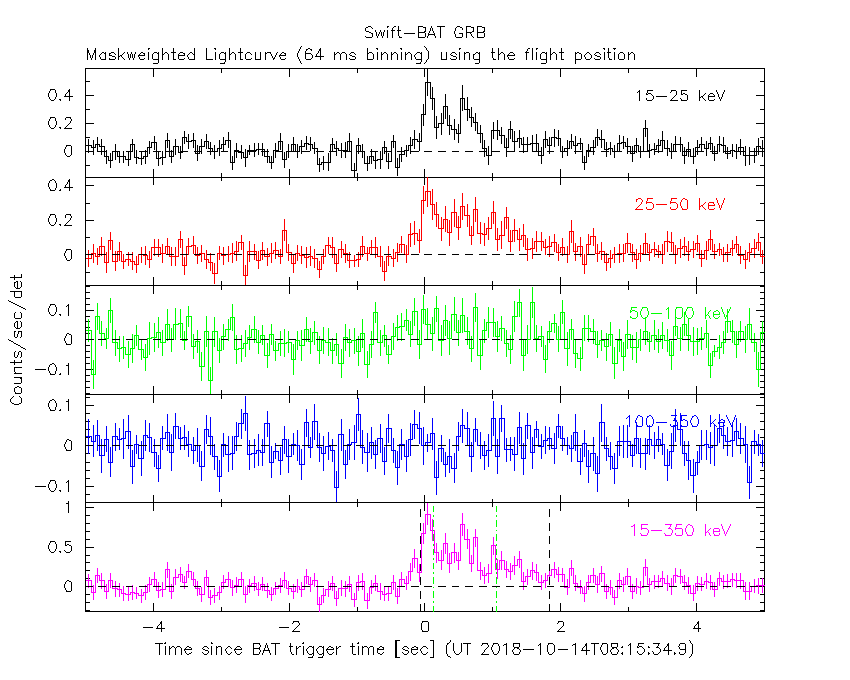
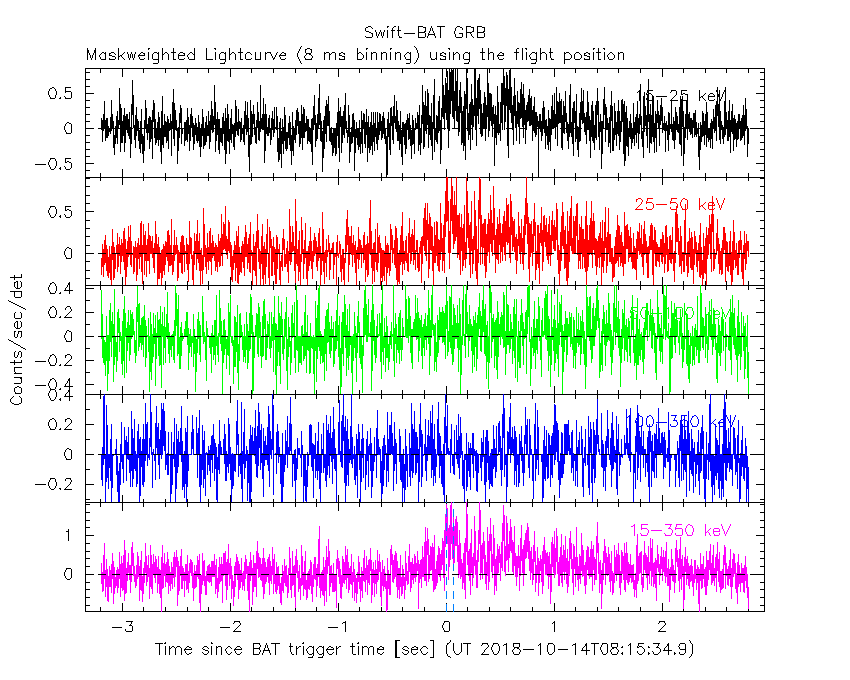
Lightcurves
Notes:
- 1) All plots contain as much data as has been downloaded to date.
- 2) The mask-weighted light curves are using the flight position.
- 3) Multiple plots of different time binning/intervals are shown to cover all scenarios of short/long GRBs, rate/image triggers, and real/false positives.
- 4) For all the mask-weighted lightcurves, the y-axis units are counts/sec/det where a det is 0.4 x 0.4 = 0.16 sq cm.
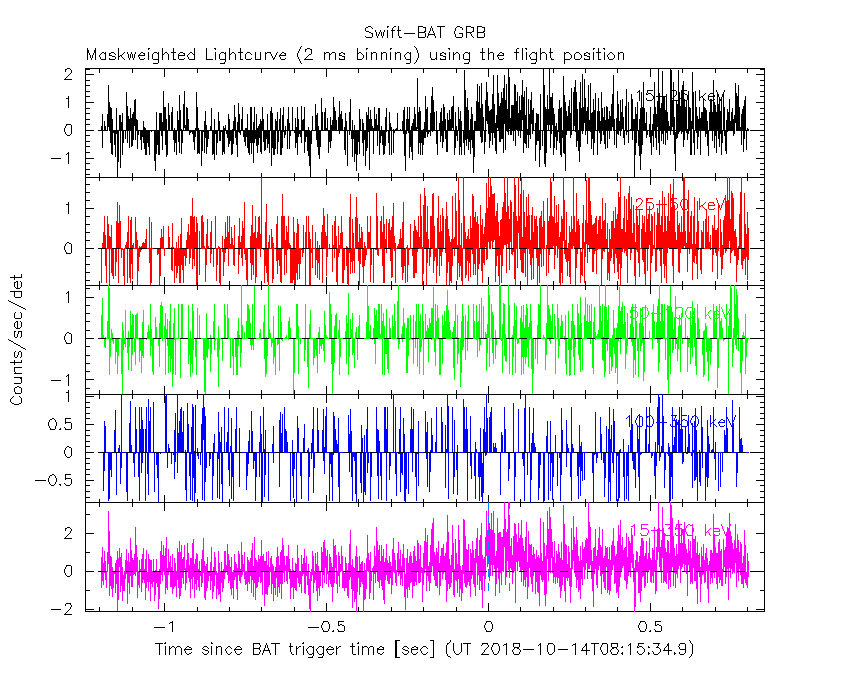
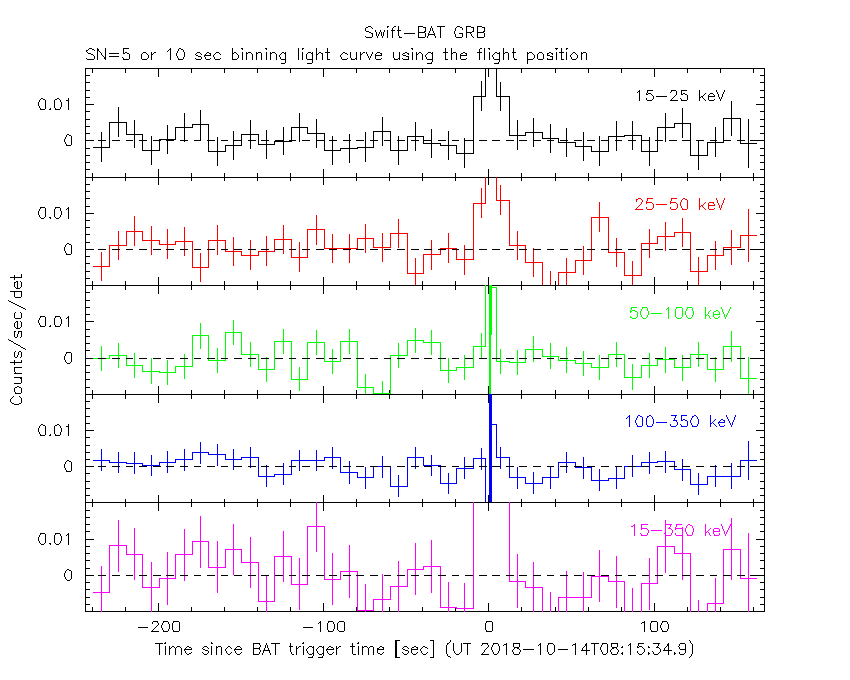
- 5) The verticle lines correspond to following: green dotted lines are T50 interval, black dotted lines are T90 interval, blue solid line(s) is a spacecraft slew start time, and orange solid line(s) is a spacecraft slew end time.
- 6) Time of each bin is in the middle of the bin.
1 s binning
From T0-310 s to T0+310 s
From T100_start - 20 s to T100_end + 30 s
Full time interval
64 ms binning
Full time interval
From T100_start to T100_end
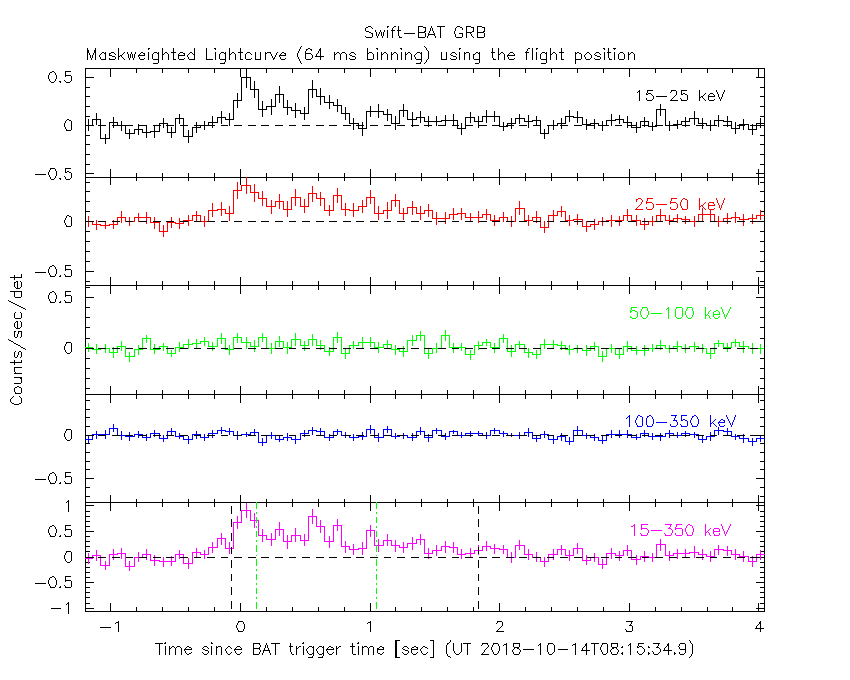
From T0-5 sec to T0+5 sec
16 ms binning
From T100_start-5 s to T100_start+5 s

8 ms binning
From T100_start-3 s to T100_start+3 s
2 ms binning
From T100_start-1 s to T100_start+1 s
SN=5 or 10 sec. binning (whichever binning is satisfied first)
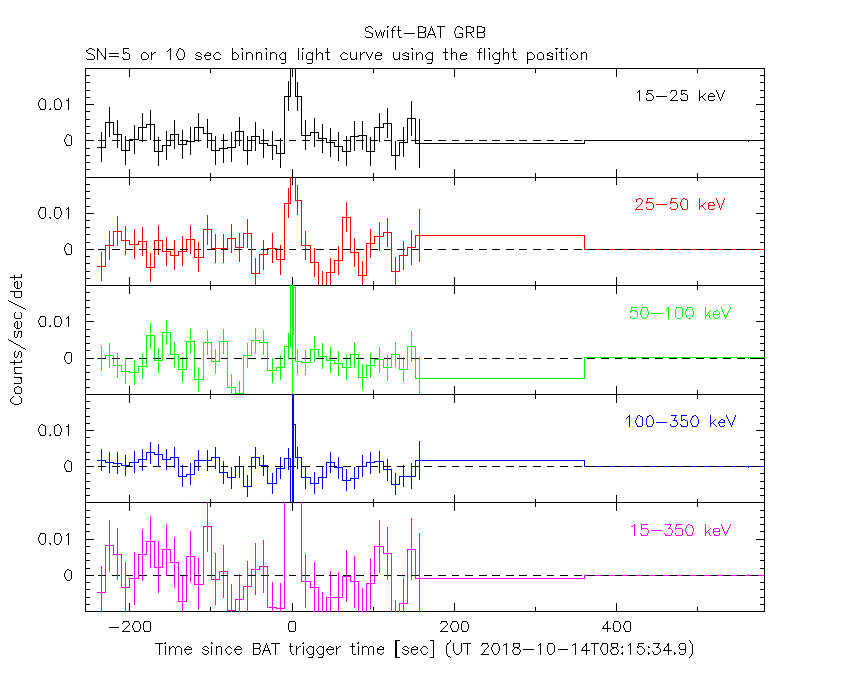
SN=5 or 10 sec. binning (T < 200 sec)
Spectra
Notes:
- 1) The fitting includes the systematic errors.
- 2) For long bursts, a spectral fit of the pre-slew DRM will introduce some errors in both a spectral shape and a normalization if the PHA file contains a lot of the slew/post-slew time interval.
- 3) For fits to more complicated models (e.g. a power-law over a cutoff power-law), the BAT team has decided to require a chi-square improvement of more than 6 for each extra dof.
- 4) For short bursts (T90<1sec), the specrtum is also fit with Blackbody, OTTB, and Double Blackbody.
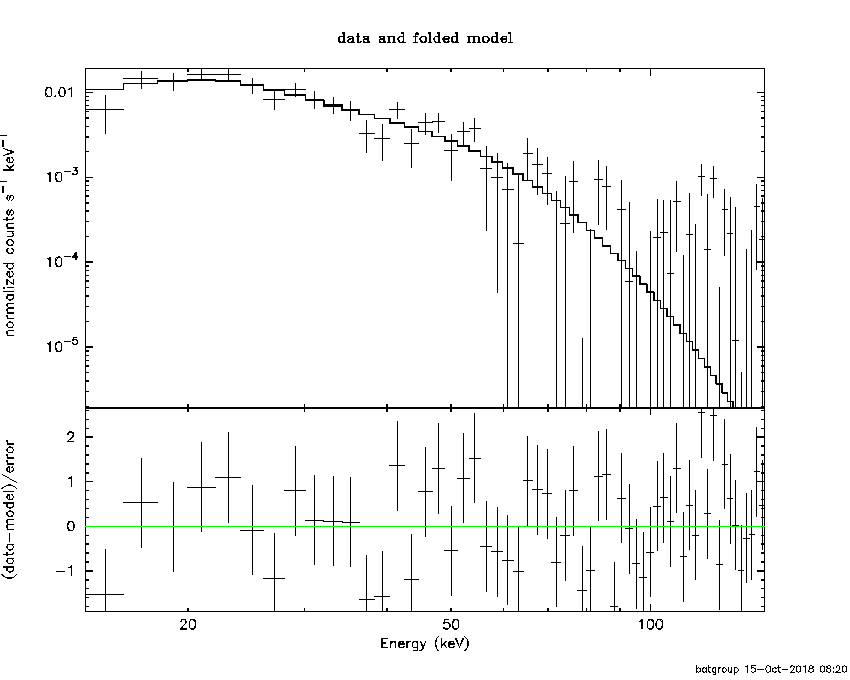
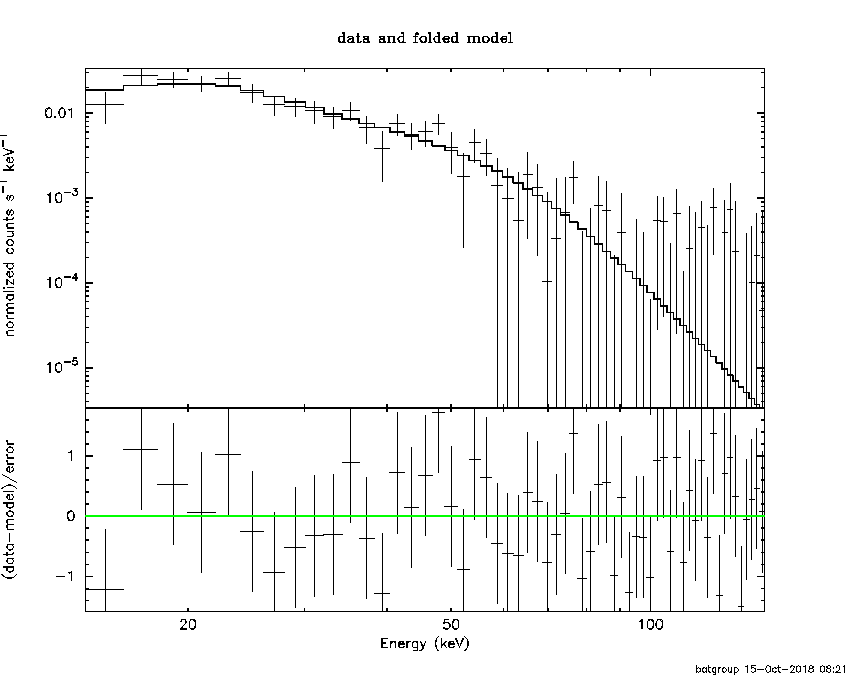
Time averaged spectrum fit using the pre-slew DRM
Power-law model
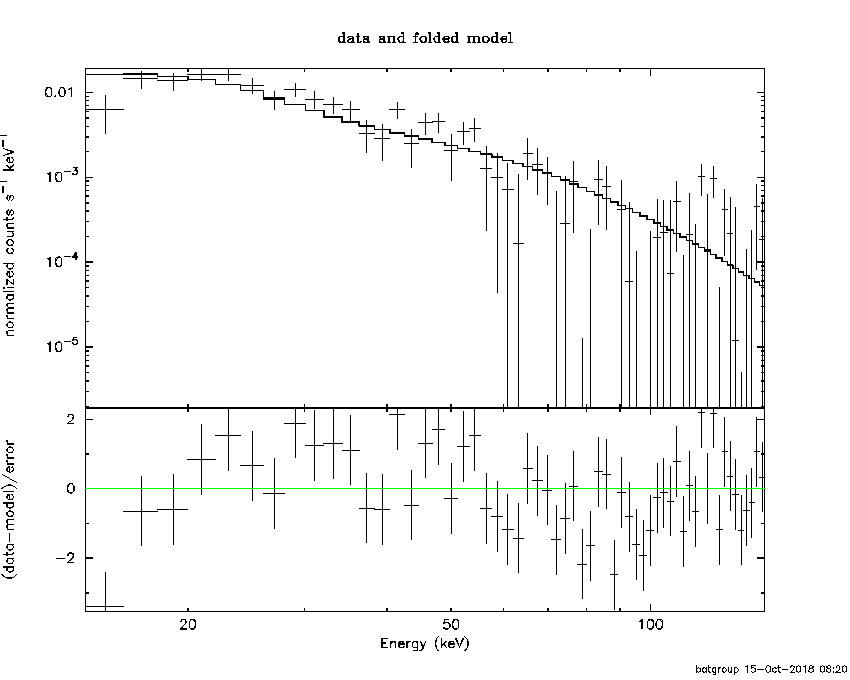
Time interval is from   -0.196 sec. to    2.044 sec.

Spectral model in power-law:
------------------------------------------------------------
Parameters  : value       lower 90%   higher 90%
Photon index: 2.38209     ( -0.158589   0.167244 )
Norm@50keV  : 1.71310E-02    ( -0.00216982   0.00214851 )
------------------------------------------------------------
#Fit statistic : Chi-Squared =          86.17 using 59 PHA bins.
# Reduced chi-squared =          1.512 for     57 degrees of freedom
# Null hypothesis probability =   7.567251e-03

Photon flux (15-150 keV)    in 2.24 sec: 3.13678 ( -0.297336  0.297455 ) ph/cm2/s
Energy fluence (15-150 keV)             : 3.7281e-07 ( -3.92152e-08  3.96646e-08 ) ergs/cm2
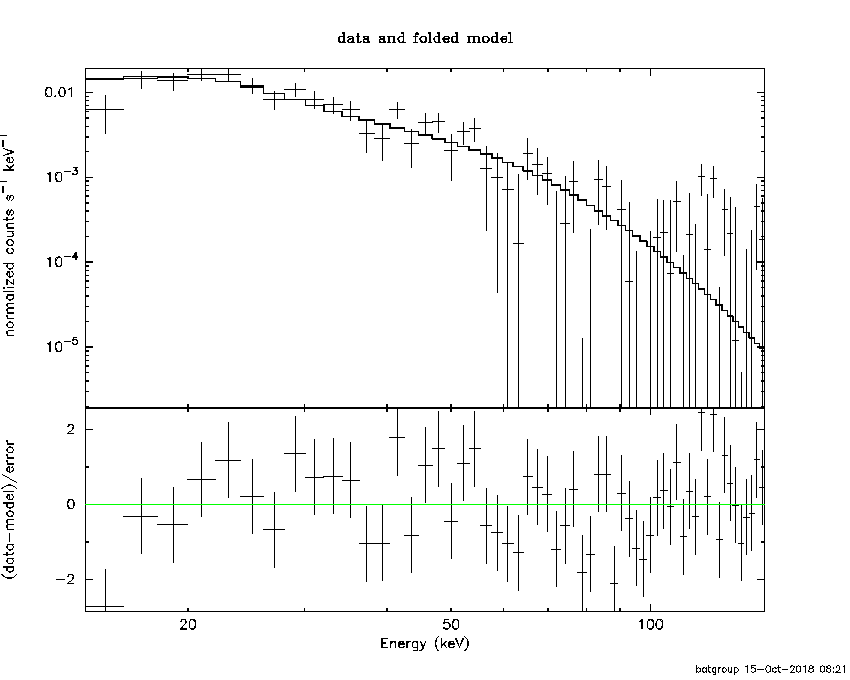
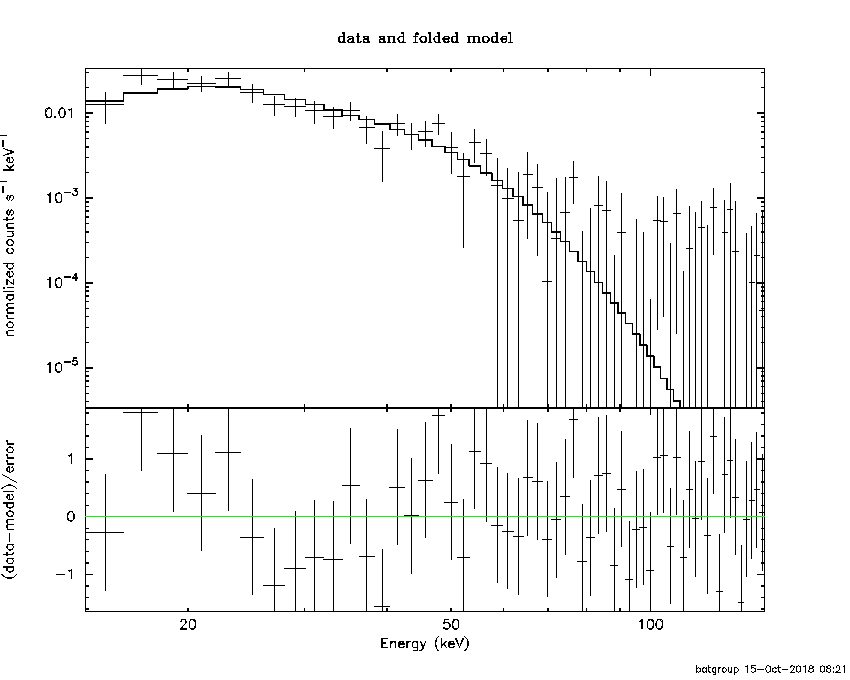
Cutoff power-law model
Time interval is from   -0.196 sec. to    2.044 sec.
Spectral model in the cutoff power-law:
------------------------------------------------------------
Parameters  : value       lower 90%   higher 90%
Photon index: -0.387176     ( -1.26664   1.05666 )
Epeak [keV] : 31.2631      ( -4.10263 3.4319 )
Norm@50keV  : 0.928690    ( -0.930257   5.07134 )
------------------------------------------------------------
#Fit statistic : Chi-Squared =          60.25 using 59 PHA bins.
# Reduced chi-squared =          1.076 for     56 degrees of freedom
# Null hypothesis probability =   3.246521e-01

Photon flux (15-150 keV)    in 2.24 sec: 3.03461 ( -0.29635  0.29702 ) ph/cm2/s
Energy fluence (15-150 keV)             : 3.28646e-07 ( -3.45856e-08  3.62477e-08 ) ergs/cm2
Band function

Time interval is from   -0.196 sec. to    2.044 sec.

Spectral model in the Band function:
------------------------------------------------------------
Parameters  : value       lower 90%   higher 90%
alpha       : 0.411705   ( -1.30104   -0.624053 )
beta        : -5.12406    ( 4.5413   1.63186 )
Epeak [keV] : 31.2037      ( -5.18993 3.53577 )
Norm@50keV   : 0.969199    ( -0.9692   1075.07 )
------------------------------------------------------------
#Fit statistic : Chi-Squared =          60.08 using 59 PHA bins.
# Reduced chi-squared =          1.092 for     55 degrees of freedom
# Null hypothesis probability =   2.969954e-01

Photon flux (15-150 keV)    in 2.24 sec:  (    ) ph/cm2/s
Energy fluence (15-150 keV)             : 3.32297e-07 ( 0  0 ) ergs/cm2
Single BB

Spectral model blackbody:
------------------------------------------------------------
Parameters  : value    Lower 90%  Upper 90%
kT [keV]    : 8.27677  (-0.697291  0.745539)
R^2/D10^2   : 3.23368  (-0.974959   1.41311)
(R is the radius in km and D10 is the distance to the source in units of 10 kpc)
------------------------------------------------------------
#Fit statistic : Chi-Squared =          63.19 using 59 PHA bins.
# Reduced chi-squared =          1.109 for     57 degrees of freedom
# Null hypothesis probability =   2.670307e-01

Energy  Fluence     90% Error
[keV]   [erg/cm2]   [erg/cm2]
15- 25  9.192e-08   1.401e-08
25- 50  1.705e-07   1.876e-08
50-150  5.001e-08   1.308e-08
15-150  3.124e-07   3.282e-08
Thermal bremsstrahlung (OTTB)
Spectral model: thermal bremsstrahlung
------------------------------------------------------------
Parameters  : value         Lower 90%    Upper 90%
kT [keV]    : 36.4599       (-6.21855      7.98716)
Norm        : 22.4463       (-3.56994     4.23234)
------------------------------------------------------------
#Fit statistic : Chi-Squared =          68.19 using 59 PHA bins.
# Reduced chi-squared =          1.196 for     57 degrees of freedom
# Null hypothesis probability =   1.473000e-01

Energy  Fluence     90% Error
[keV]   [erg/cm2]   [erg/cm2]
15- 25  1.117e-07   1.267e-08
25- 50  1.409e-07   1.427e-08
50-150  9.819e-08   2.788e-08
15-150  3.507e-07   3.707e-08
Double BB

Spectral model: bbodyrad<1> + bbodyrad<2>
------------------------------------------------------------
Parameters  : value         Lower 90%    Upper 90%
kT1 [keV]   : 5.54381        (-2.78768      -5.54381)
R1^2/D10^2  : 7.62755        (-6.26656      54.7558)
kT2 [keV]   : 10.5837        (-5.14042      -10.5837)
R2^2/D10^2  : 0.771287    (-0.767796   1.36789)
------------------------------------------------------------
#Fit statistic : Chi-Squared =          59.70 using 59 PHA bins.
# Reduced chi-squared =          1.085 for     55 degrees of freedom
# Null hypothesis probability =   3.089436e-01

Energy  Fluence     90% Error
[keV]   [erg/cm2]   [erg/cm2]
15- 25  1.018e-07   5.570e-08
25- 50  1.593e-07   8.396e-08
50-150  6.950e-08   3.931e-08
15-150  3.306e-07   1.717e-07
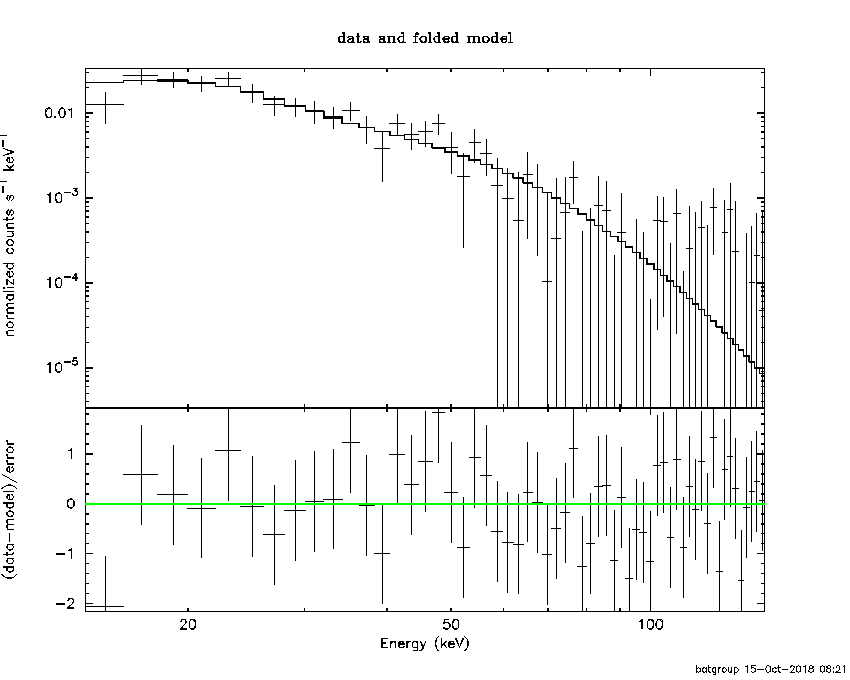
Peak spectrum fit
Power-law model
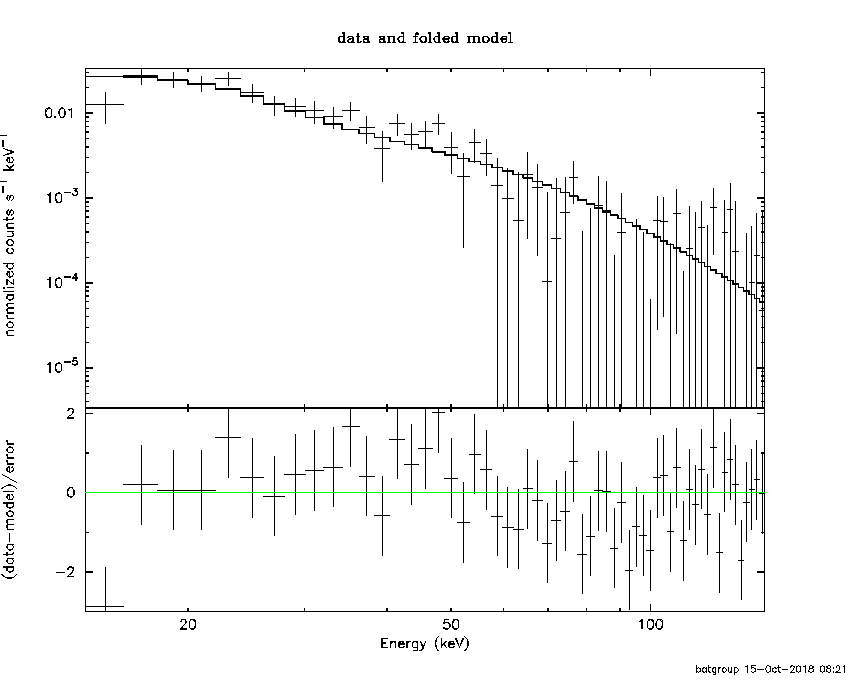
Time interval is from   -0.176 sec. to    0.824 sec.

Spectral model in power-law:
------------------------------------------------------------
Parameters  : value       lower 90%   higher 90%
Photon index: 2.54630     ( -0.18133   0.195131 )
Norm@50keV  : 2.33215E-02    ( -0.00350575   0.00346993 )
------------------------------------------------------------
#Fit statistic : Chi-Squared =          54.28 using 59 PHA bins.
# Reduced chi-squared =         0.9522 for     57 degrees of freedom
# Null hypothesis probability =   5.778820e-01

Photon flux (15-150 keV)    in 1 sec: 4.71450 ( -0.494591  0.49474 ) ph/cm2/s
Energy fluence (15-150 keV)             : 2.36232e-07 ( -2.75116e-08  2.78662e-08 ) ergs/cm2
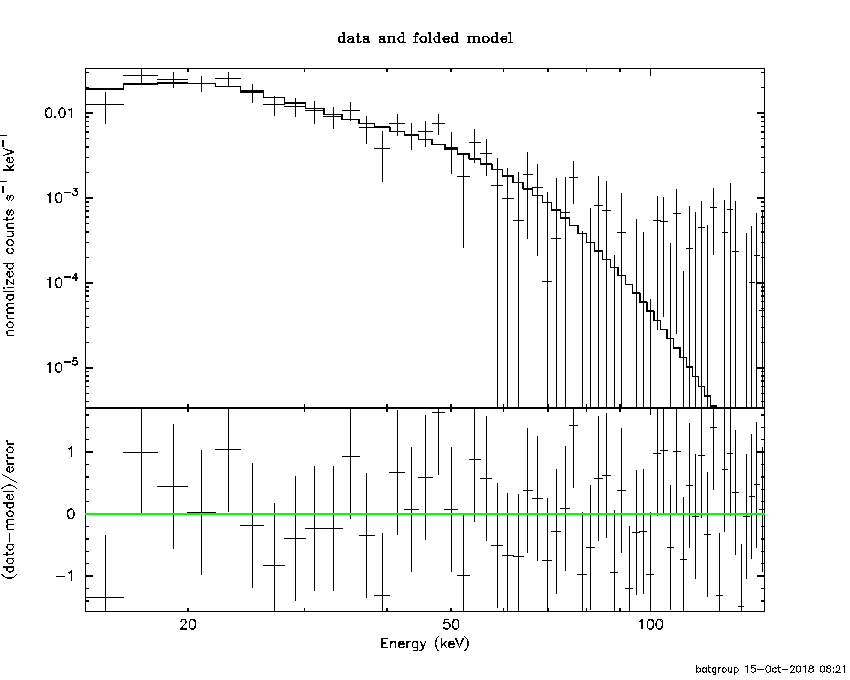
Cutoff power-law model
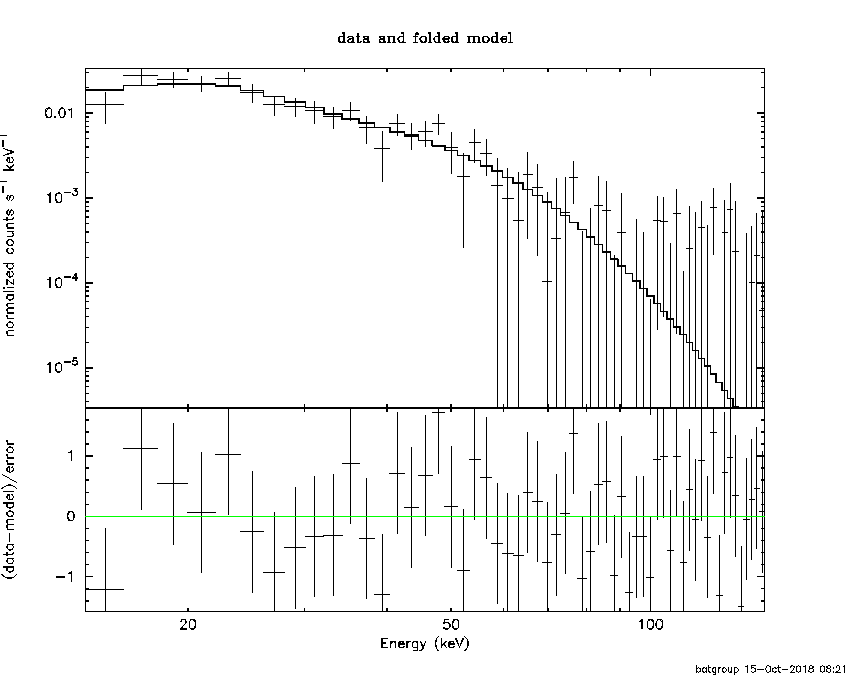
Time interval is from   -0.176 sec. to    0.824 sec.
Spectral model in the cutoff power-law:
------------------------------------------------------------
Parameters  : value       lower 90%   higher 90%
Photon index: 0.132582     ( -1.3316   1.08921 )
Epeak [keV] : 28.1658      ( -7.36923 4.41173 )
Norm@50keV  : 0.759023    ( -0.758722   4.61059 )
------------------------------------------------------------
#Fit statistic : Chi-Squared =          36.55 using 59 PHA bins.
# Reduced chi-squared =         0.6528 for     56 degrees of freedom
# Null hypothesis probability =   9.794379e-01

Photon flux (15-150 keV)    in 1 sec: 4.59946 ( -0.49575  0.4961 ) ph/cm2/s
Energy fluence (15-150 keV)             : 2.15886e-07 ( -2.4967e-08  2.6082e-08 ) ergs/cm2
Band function
Time interval is from   -0.176 sec. to    0.824 sec.

Spectral model in the Band function:
------------------------------------------------------------
Parameters  : value       lower 90%   higher 90%
alpha       : -0.151426   ( -1.06583   1.42493 )
beta        : -6.10128    ( 6.04445   2.73595 )
Epeak [keV] : 28.1034      ( -7.21397 3.83726 )
Norm@50keV   : 0.739694    ( -0.236454   5.71524 )
------------------------------------------------------------
#Fit statistic : Chi-Squared =          36.53 using 59 PHA bins.
# Reduced chi-squared =         0.6642 for     55 degrees of freedom
# Null hypothesis probability =   9.740203e-01

Photon flux (15-150 keV)    in 1 sec:  (    ) ph/cm2/s
Energy fluence (15-150 keV)             : 2.27936e-07 ( -2.27929e-07  -2.8371e-08 ) ergs/cm2
Single BB
Spectral model blackbody:
------------------------------------------------------------
Parameters  : value    Lower 90%  Upper 90%
kT [keV]    : 7.92086  (-0.773755  0.821536)
R^2/D10^2   : 5.67390  (-1.92574   3.03135)
(R is the radius in km and D10 is the distance to the source in units of 10 kpc)
------------------------------------------------------------
#Fit statistic : Chi-Squared =          41.18 using 59 PHA bins.
# Reduced chi-squared =         0.7224 for     57 degrees of freedom
# Null hypothesis probability =   9.432492e-01

Energy  Fluence     90% Error
[keV]   [erg/cm2]   [erg/cm2]
15- 25  6.389e-08   1.027e-08
25- 50  1.099e-07   1.457e-08
50-150  2.793e-08   8.910e-09
15-150  2.017e-07   2.700e-08
Thermal bremsstrahlung (OTTB)
Spectral model: thermal bremsstrahlung
------------------------------------------------------------
Parameters  : value         Lower 90%    Upper 90%
kT [keV]    : 31.6605       (-5.72114      7.27042)
Norm        : 37.4811       (-6.80224     8.43822)
------------------------------------------------------------
#Fit statistic : Chi-Squared =          39.95 using 59 PHA bins.
# Reduced chi-squared =         0.7009 for     57 degrees of freedom
# Null hypothesis probability =   9.579152e-01

Energy  Fluence     90% Error
[keV]   [erg/cm2]   [erg/cm2]
15- 25  7.833e-08   1.002e-08
25- 50  9.215e-08   1.207e-08
50-150  5.410e-08   1.763e-08
15-150  2.246e-07   2.765e-08
Double BB
Spectral model: bbodyrad<1> + bbodyrad<2>
------------------------------------------------------------
Parameters  : value         Lower 90%    Upper 90%
kT1 [keV]   : 4.12414        (-1.82479      2.22055)
R1^2/D10^2  : 35.1612        (-28.2929      468.549)
kT2 [keV]   : 9.63616        (-1.59868      4.8472)
R2^2/D10^2  : 1.96491    (-1.81828   3.08748)
------------------------------------------------------------
#Fit statistic : Chi-Squared =          35.80 using 59 PHA bins.
# Reduced chi-squared =         0.6509 for     55 degrees of freedom
# Null hypothesis probability =   9.791021e-01

Energy  Fluence     90% Error
[keV]   [erg/cm2]   [erg/cm2]
15- 25  7.366e-08   3.805e-08
25- 50  1.010e-07   5.280e-08
50-150  4.067e-08   2.428e-08
15-150  2.153e-07   1.088e-07
Plot creation:
Mon Oct 15 08:22:12 EDT 2018