batgrbproduct analysis for trigger=848890
batgrbproduct Analysis for Trigger=848890
Analysis Summary
Notes:
- 1) No attempt has been made to eliminate the non-significant decimal places.
- 2) This batgrbproduct analysis is done using the HEASARC data.
- 3) This batgrbproduct analysis is using the flight position for the mask-weighting calculation.
======================================================================
                  BAT GRB EVENT DATA PROCESSING REPORT
    Process Script Ver: batgrbproduct v2.46
    Process Start Time (local time): Fri Jul 20 22:04:56 EDT 2018
             Host Name: bat1
   Current Working Dir: /local/data/bat1/prebascript/trigger848890/batgroup_hand_proc
======================================================================

  Trigger: 00848890      Segment: 000

  BAT Trigger Time: 553789325.888   [s; MET]
      Trigger Stop: 553789326.912   [s; MET]
               UTC: 2018-07-20T14:21:44.593440    [includes UTCF correction]
       Where From?: TDRSS position message

  BAT
    RA: 0.52968200447337   Dec: -2.93344156841311  [deg; J2000]

     Catalogged Source?: NO
     Point Source?:      YES
     GRB Indicated?:     YES    [ by BAT flight software ]
     Image S/N Ratio:    12.41
     Image Trigger?:     NO
     Rate S/N Ratio:     135.970585054268  [ if not an image trigger ]
     Image S/N Ratio:    12.41

  Flight Position:   [ source = BAT ]
    RA: 0.52968200447337   Dec: -2.93344156841311  [deg; J2000]

  Ground Position:   [ source = BAT pre-slew burst ]
    RA: 0.528571841222877   Dec: -2.92552612118528  [deg; J2000]
        { 00h 02m 06.9s , -02d 55' 31.9" }
         +/- 1.16091989332408 [arcmin] (estimated 90% radius based on SNR)
         +/- 0.41793099795083 [arcmin] (formal 1-sigma fit error)
    SNR: 24.5778411209893

  Angular difference between Flight and Ground position is 0.479563 arcmin

  Partial Coding Fraction: 0.08496094    [ including projection effects ]

  Duration
     T90: 108.399999856949 +/- 3.6884533781446
        Measured from: 0.220000028610229
                   to: 108.619999885559     [s; relative to TRIGTIME]
     T50: 20.067999958992 +/- 1.06384957132124
        Measured from: 8.28799998760223
                   to: 28.3559999465942     [s; relative to TRIGTIME]


  Fluence
     Peak Flux  (peak 1 second)
        Measured from: 10.9359999895096
                   to: 11.9359999895096     [s; relative to TRIGTIME]
     Total Fluence
        Measured from: -3.81599998474121
                   to: 527.728000044823     [s; relative to TRIGTIME]

             Band 1     Band 2     Band 3     Band 4
              15-25      25-50     50-100    100-350     keV
 Total    27.985057  42.002746  38.493033  13.089993
           0.287209   0.348442   0.353681   0.280679 [error]
 Peak      1.265924   2.649425   3.050419   1.236563
           0.064338   0.090272   0.105104   0.086043 [error]

     [ fluence units of on-axis counts / fully illuminated detector ]

======================================================================

=== Fluence/Peak Flux Summary ===

              Model    Band1    Band2    Band3    Band4    Band5    Total
                       15-25    25-50   50-100  100-350   15-150   15-350   keV
Fluence   Power-law 9.81e-06 1.97e-05 3.08e-05 1.06e-04 8.59e-05 1.67e-04   erg/cm2
              Error 3.42e-07 3.99e-07 4.78e-07 4.01e-06 1.25e-06 4.08e-06   erg/cm2
Peak flux Power-law 1.54e+01 2.06e+01 2.02e+01 3.57e+01 6.79e+01 9.19e+01   ph/cm2/s
              Error 1.14e+00 9.35e-01 8.39e-01 3.11e+00 2.58e+00 3.80e+00   ph/cm2/s

Fluence   Cutoff-PL 9.81e-06 1.97e-05 3.09e-05 1.06e-04 8.59e-05 1.77e-04   erg/cm2
              Error -------- 3.99e-07 4.79e-07 -------- 1.25e-06 --------   erg/cm2
Peak flux Cutoff-PL 1.40e+01 2.10e+01 2.12e+01 2.53e+01 6.72e+01 8.16e+01   ph/cm2/s
              Error 1.44e+00 1.01e+00 1.07e+00 6.03e+00 2.63e+00 6.49e+00   ph/cm2/s

Fluence        Band -------- -------- -------- -------- -------- --------   erg/cm2
              Error -------- -------- -------- -------- -------- --------   erg/cm2
Peak flux      Band -------- -------- -------- -------- -------- --------   ph/cm2/s
              Error -------- -------- -------- -------- -------- --------   ph/cm2/s
=== Time-averaged spectral analysis ===

Model Ph_index Ph_90err Epeak  Epeak_90err Norm     Nomr_90err chi2   dof
PL    1.357    0.028    -      -           8.99e-03 1.37e-04   36.960 57
CPL   1.353    0.029    10000.0    0.0      9.02e-03 1.34e-04   37.170 56


=== 1-s peak spectral analysis ===

Model Ph_index Ph_90err Epeak  Epeak_90err Norm     Nomr_90err chi2   dof
PL    1.026    0.063    -      -           5.89e-01 2.20e-02   74.420 57
CPL   0.664    0.259     214.7  194.2      8.53e-01 2.24e-01   68.220 56

Model      : spectral model: simple power-law (PL) and cutoff power-law (CPL)
Ph_index   : photon index: E^-{Ph_index} (minus sign is not included in the index)
Ph_90err   : 90% error of the photon index
Epeak      : Epeak in keV
Epeak_90err: 90% error of Epeak
Norm       : normalization at 50 keV in PL model and at 1 keV in CPL model
Nomr_90err : 90% error of the normalization
chi2       : Chi-Squared
dof        : degree of freedom
=== T90/T50 calculation in the 50-300 keV band (BATSE band) using 64 ms lc ===

T90 in the 50-300 keV band: 68.544000 sec.
T50 in the 50-300 keV band: 17.600000 sec.
=== Table of the duration information ==

        Value   tstart    tstop
T100  531.544   -3.816  527.728
T90   108.400    0.220  108.620
T50    20.068    8.288   28.356
Peak    1.000   10.936   11.936
Image
Pre-slew 15.0-350.0 keV image (Event data)
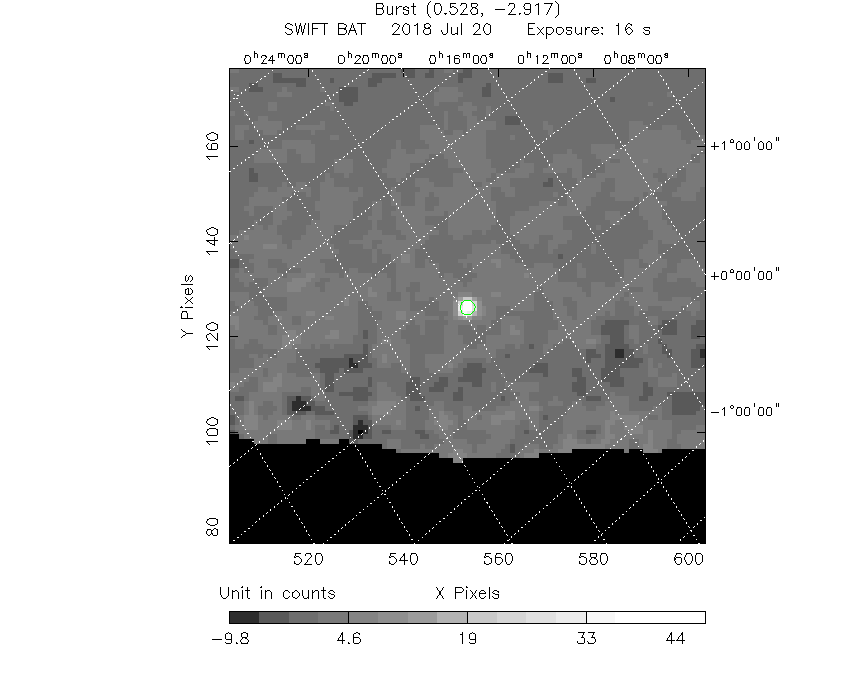
#   RAcent    DECcent   POSerr    Theta     Phi              Peak Cts       SNR   Name
    0.5286    -2.9255   0.0078    45.1652    47.0600        49.7042722     24.578 TRIG_00848890

Foreground time interval of the image:
 -3.816  12.013 (delta_t =  15.829 [sec])
Background time interval of the image:
-40.387  -3.816 (delta_t =  36.571 [sec])
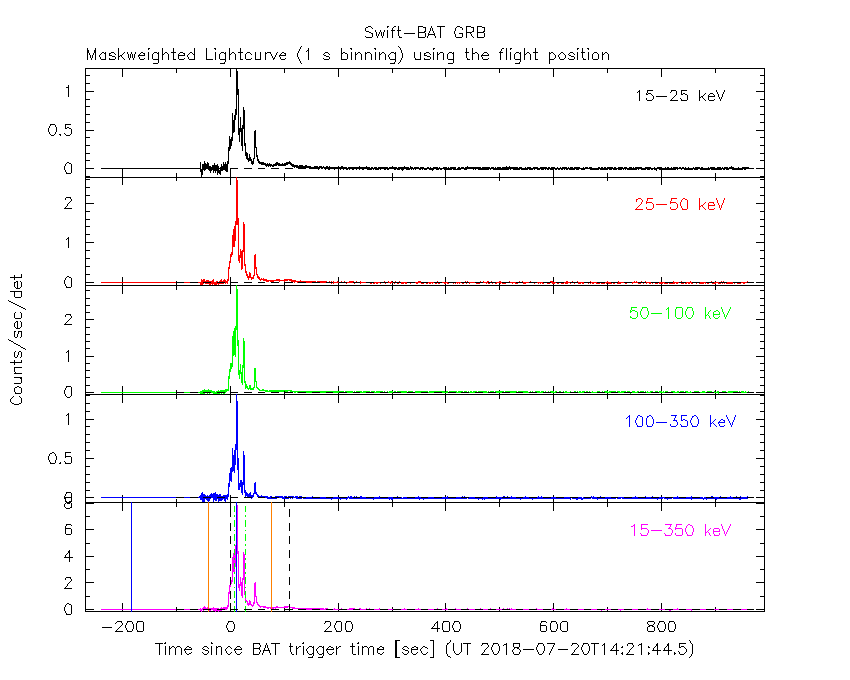
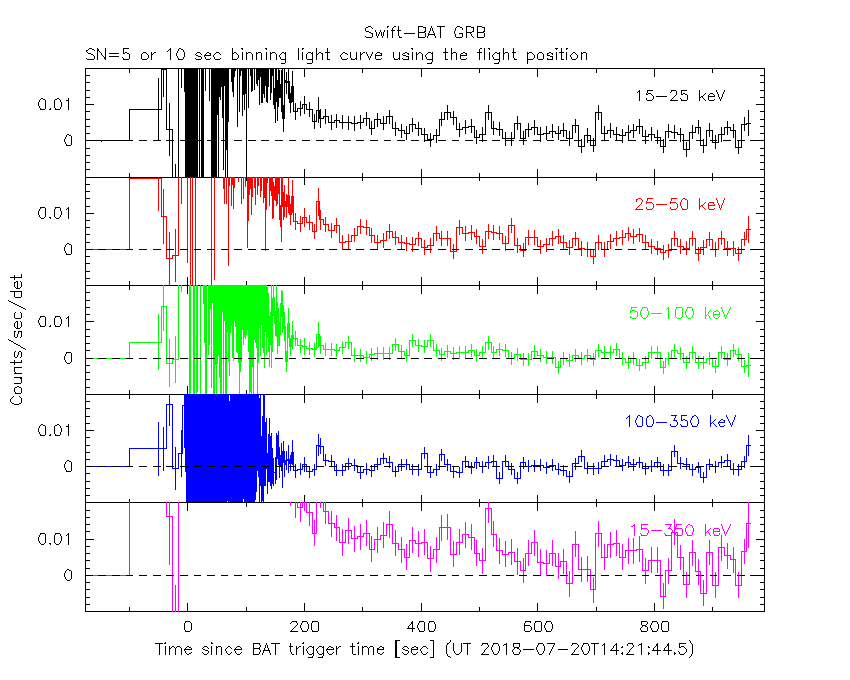
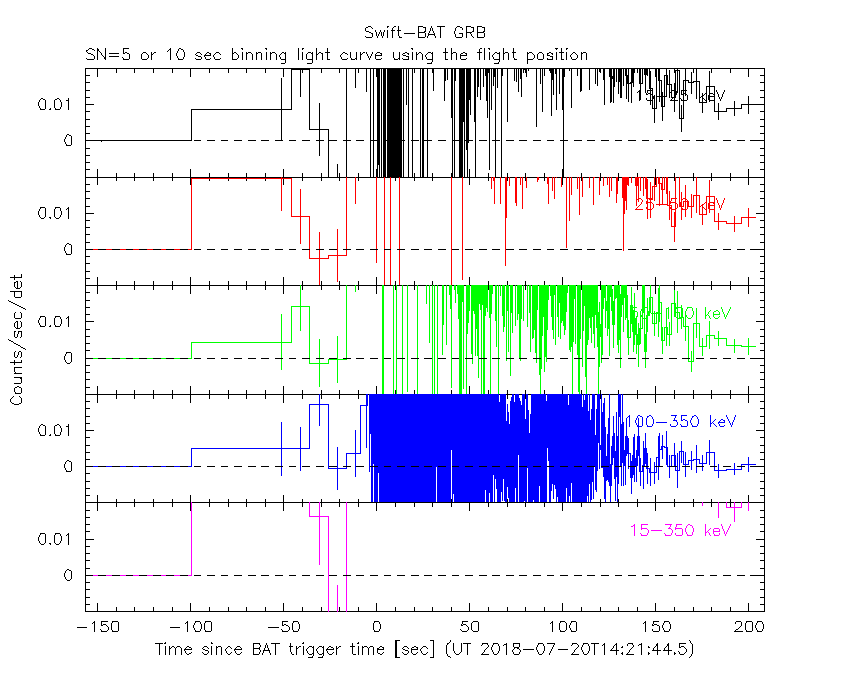
Lightcurves
Notes:
- 1) The mask-weighted light curves are using the flight position.
- 2) Multiple plots of different time binning/intervals are shown to cover all scenarios of short/long GRBs, rate/image triggers, and real/false positives.
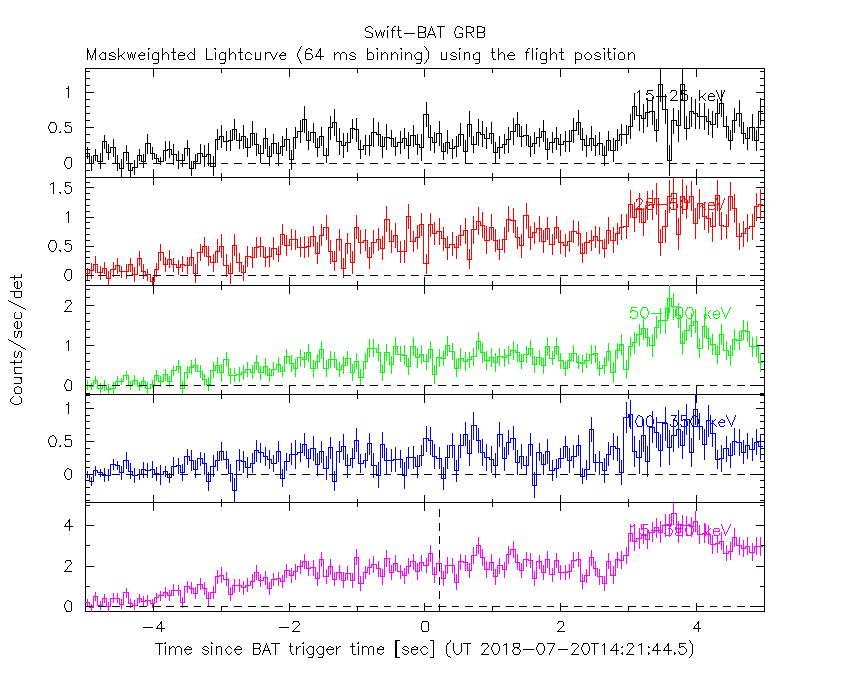
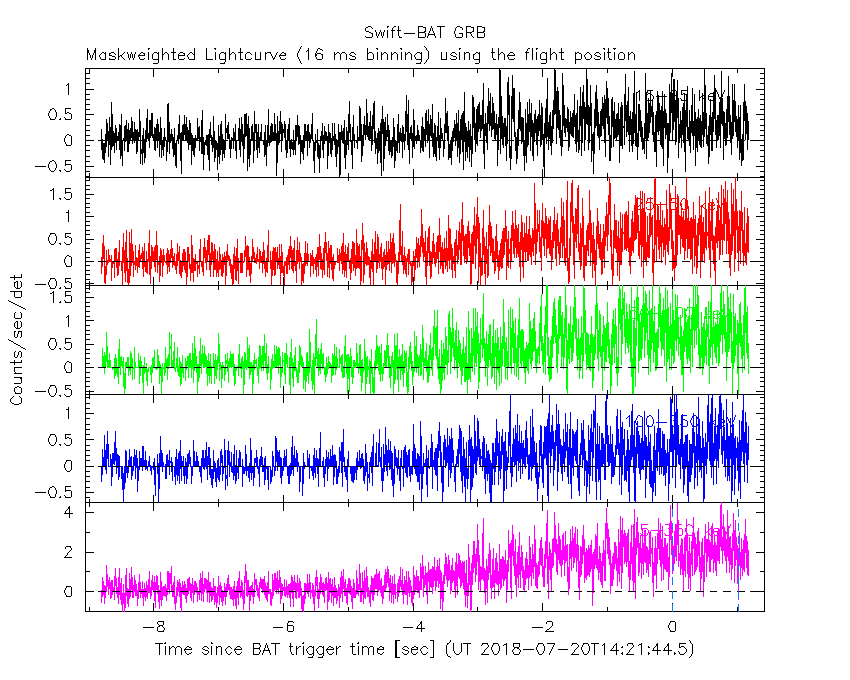
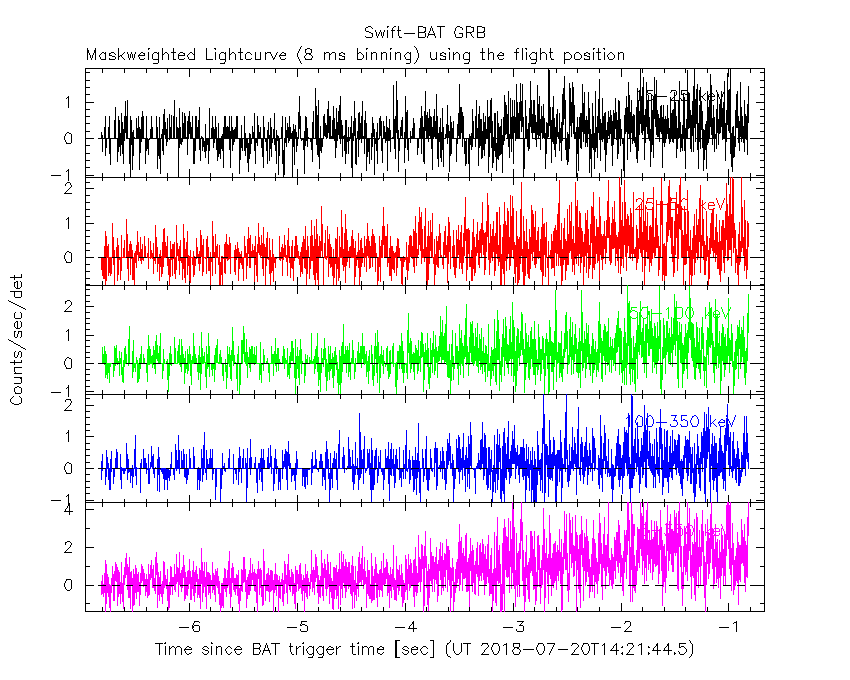
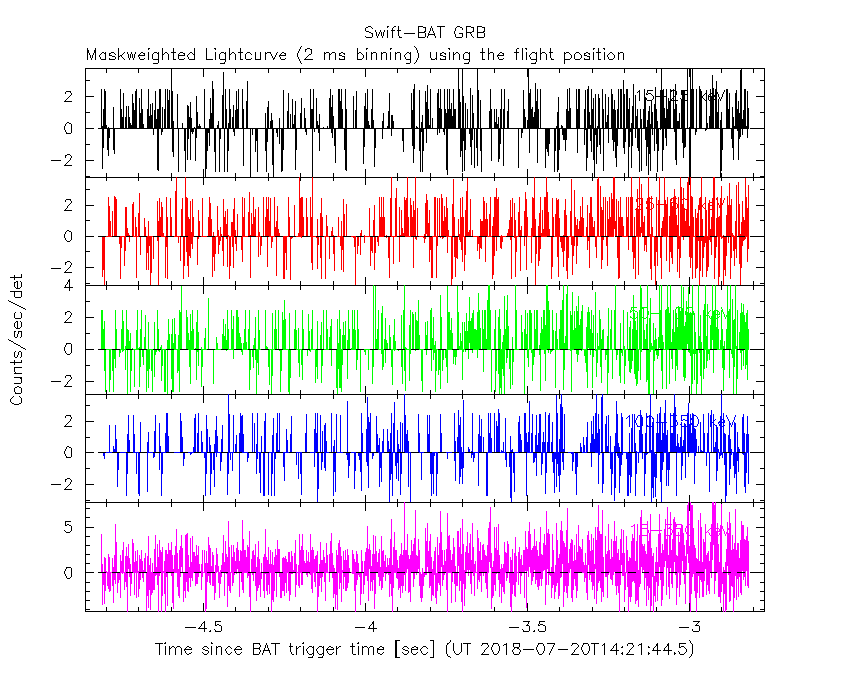
- 3) For all the mask-weighted lightcurves, the y-axis units are counts/sec/det where a det is 0.4 x 0.4 = 0.16 sq cm.
- 4) The verticle lines correspond to following: green dotted lines are T50 interval, black dotted lines are T90 interval, blue solid line(s) is a spacecraft slew start time, and orange solid line(s) is a spacecraft slew end time.
- 5) Time of each bin is in the middle of the bin.
1 s binning
From T0-310 s to T0+310 s
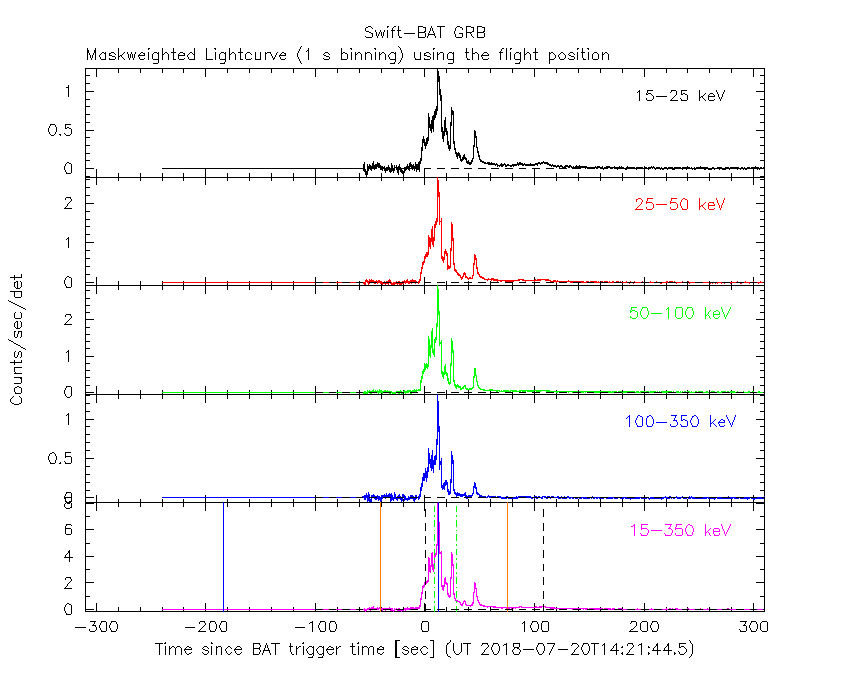
From T100_start - 20 s to T100_end + 30 s

Full time interval
64 ms binning
Full time interval

From T100_start to T100_end
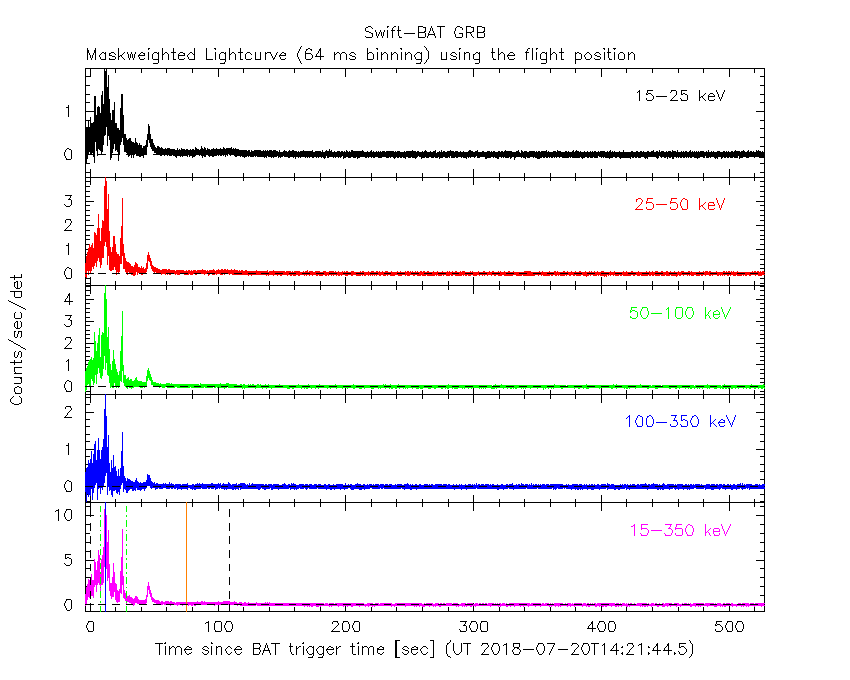
From T0-5 sec to T0+5 sec
16 ms binning
From T100_start-5 s to T100_start+5 s
8 ms binning
From T100_start-3 s to T100_start+3 s
2 ms binning
From T100_start-1 s to T100_start+1 s
SN=5 or 10 sec. binning (whichever binning is satisfied first)
SN=5 or 10 sec. binning (T < 200 sec)
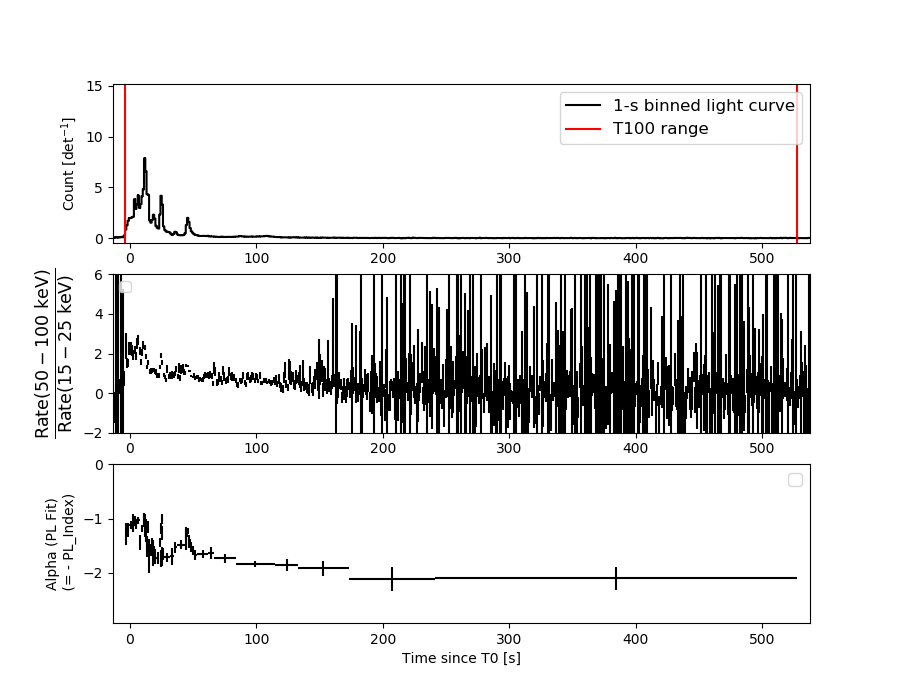
Spectral Evolution
Spectra
Notes:
- 1) The fitting includes the systematic errors.
- 2) When the burst includes telescope slew time periods, the fitting uses an average response file made from multiple 5-s response files through out the slew time plus single time preiod for the non-slew times, and weighted by the total counts in the corresponding time period using addrmf. An average response file is needed becuase a spectral fit using the pre-slew DRM will introduce some errors in both a spectral shape and a normalization if the PHA file contains a lot of the slew/post-slew time interval.
- 3) For fits to more complicated models (e.g. a power-law over a cutoff power-law), the BAT team has decided to require a chi-square improvement of more than 6 for each extra dof.
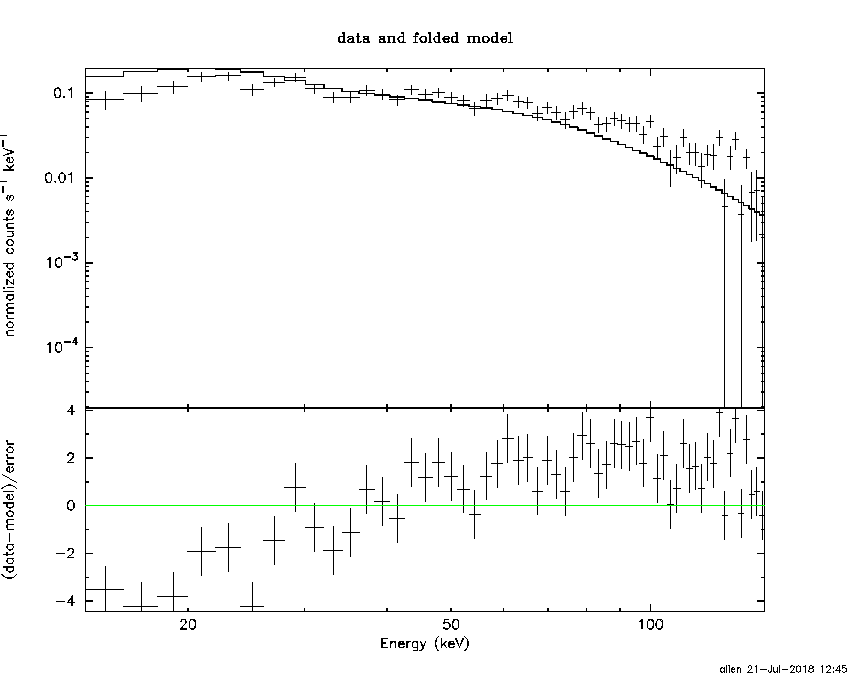
Time averaged spectrum fit using the average DRM
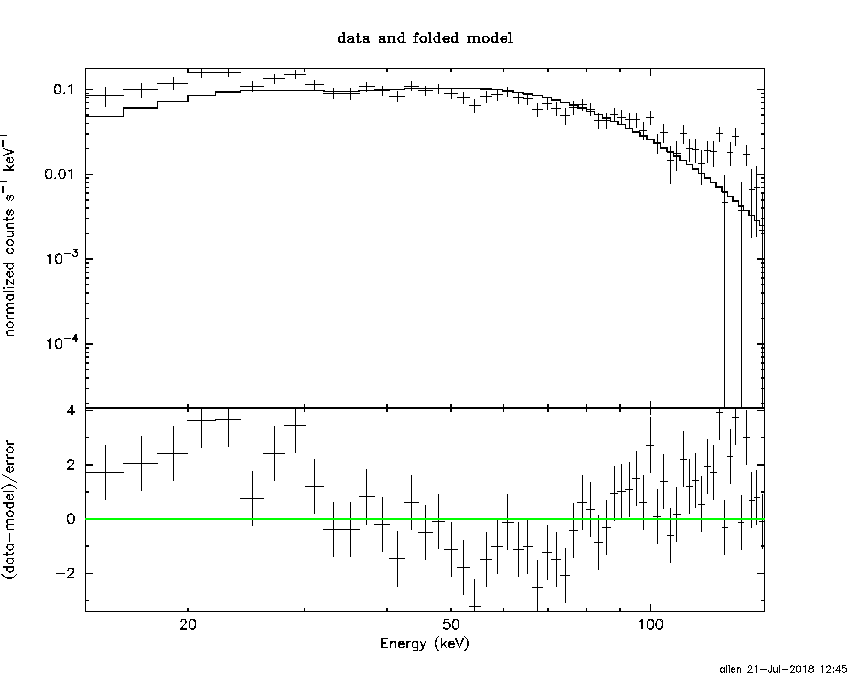
Power-law model
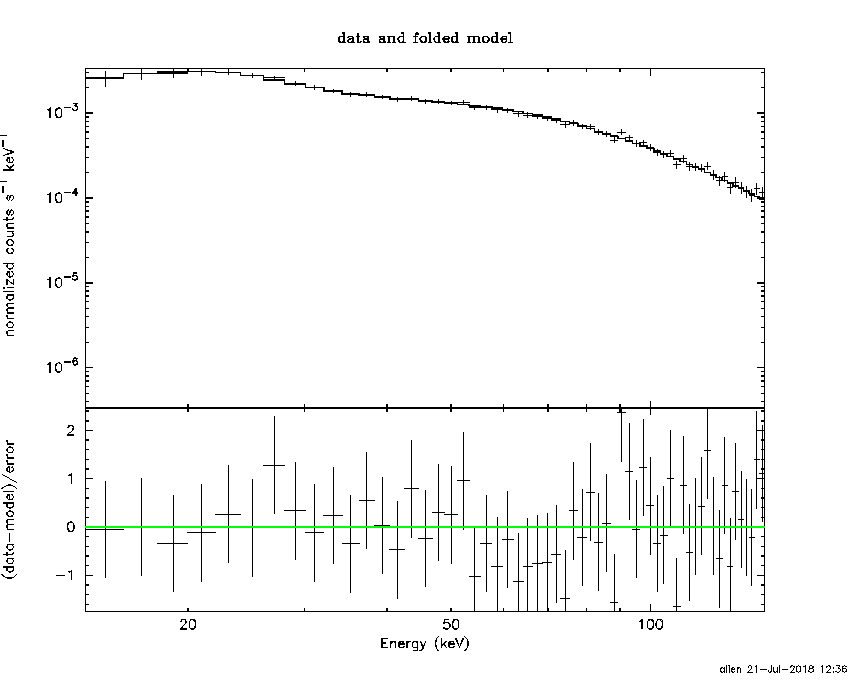
Time interval is from  -20.000 sec. to  961.112 sec.

Spectral model in power-law:
------------------------------------------------------------
Parameters  : value       lower 90%   higher 90%
Photon index: 1.35694     ( -0.0285103   0.0283626 )
Norm@50keV  : 8.98678E-03    ( -0.000137458   0.000137122 )
------------------------------------------------------------
#Fit statistic : Chi-Squared =          36.96 using 59 PHA bins.
# Reduced chi-squared =         0.6484 for     57 degrees of freedom
# Null hypothesis probability =   9.818105e-01

Photon flux (15-150 keV)    in 981.1 sec: 1.08422 ( -0.01958  0.01965 ) ph/cm2/s
Energy fluence (15-150 keV)             : 8.59911e-05 ( -1.24817e-06  1.24645e-06 ) ergs/cm2
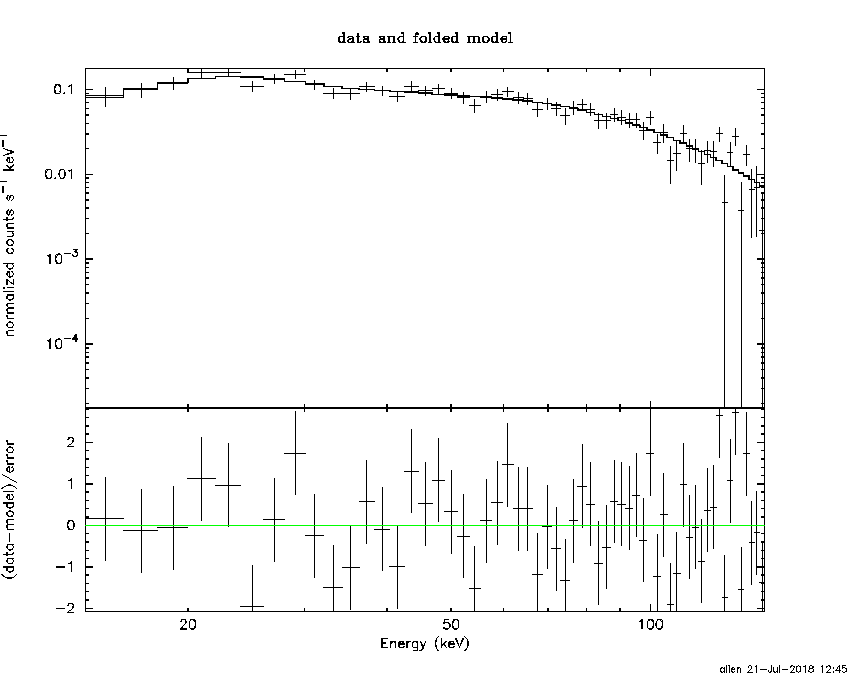
Cutoff power-law model

Time interval is from  -20.000 sec. to  961.112 sec.
Spectral model in the cutoff power-law:
------------------------------------------------------------
Parameters  : value       lower 90%   higher 90%
Photon index: 1.35291     ( -0.030804   0.0267804 )
Epeak [keV] : 1.00000E+04      ( -10000 -10000 )
Norm@50keV  : 9.02085E-03    ( -0.000137388   0.000130253 )
------------------------------------------------------------
#Fit statistic : Chi-Squared =          37.17 using 59 PHA bins.
# Reduced chi-squared =         0.6638 for     56 degrees of freedom
# Null hypothesis probability =   9.752820e-01

Photon flux (15-150 keV)    in 981.1 sec: 1.08382 (    ) ph/cm2/s
Energy fluence (15-150 keV)             : 8.59753e-05 ( -1.24798e-06  1.24216e-06 ) ergs/cm2
Band function

Time interval is from  -20.000 sec. to  961.112 sec.


Spectral model in the Band function:
------------------------------------------------------------
Parameters  : value       lower 90%   higher 90%
alpha       :    (     )
beta        :     (     )
Epeak [keV] :       (   )
Norm@50keV   :     (     )
------------------------------------------------------------

Photon flux (15-150 keV)    in  sec:  (    ) ph/cm2/s
Energy fluence (15-150 keV)             : 0 ( 0  0 ) ergs/cm2
Single BB
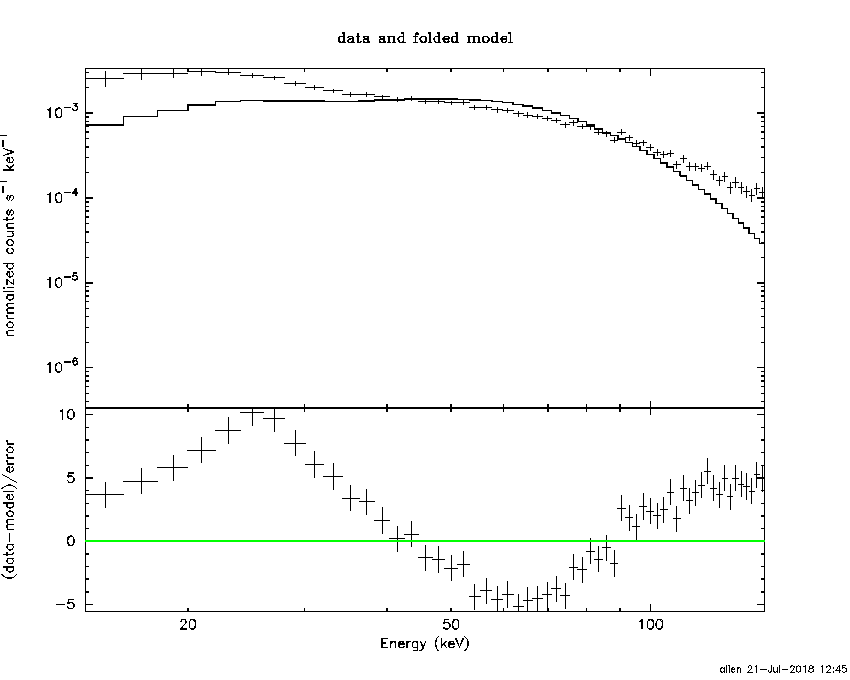
Spectral model blackbody:
------------------------------------------------------------
Parameters  : value    Lower 90%  Upper 90%
kT [keV]    : 21.1920  (  )
R^2/D10^2   : 3.74622E-02  (   )
(R is the radius in km and D10 is the distance to the source in units of 10 kpc)
------------------------------------------------------------
#Fit statistic : Chi-Squared =        1109.07 using 59 PHA bins.
# Reduced chi-squared =        19.4574 for     57 degrees of freedom
# Null hypothesis probability =  7.757307e-195

Energy  Fluence     90% Error
[keV]   [erg/cm2]   [erg/cm2]
15- 25  3.106e-06   1.001e-07
25- 50  1.606e-05   4.023e-07
50-150  5.378e-05   1.163e-06
15-150  7.295e-05   1.163e-06
Thermal bremsstrahlung (OTTB)
Spectral model: thermal bremsstrahlung
------------------------------------------------------------
Parameters  : value         Lower 90%    Upper 90%
kT [keV]    : 199.363       (      )
Norm        : 4.69490       (     )
------------------------------------------------------------
#Fit statistic : Chi-Squared =         310.14 using 59 PHA bins.
# Reduced chi-squared =         5.4410 for     57 degrees of freedom
# Null hypothesis probability =   1.656041e-36

Energy  Fluence     90% Error
[keV]   [erg/cm2]   [erg/cm2]
15- 25  1.147e-05   1.962e-07
25- 50  2.206e-05   3.679e-07
50-150  4.839e-05   8.192e-07
15-150  8.192e-05   1.526e-06
Double BB
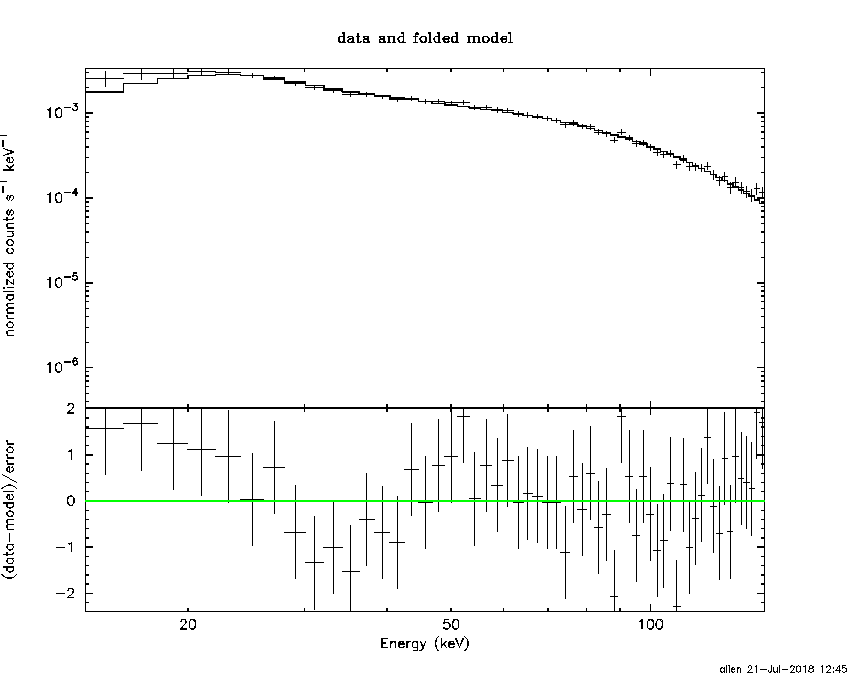
Spectral model: bbodyrad<1> + bbodyrad<2>
------------------------------------------------------------
Parameters  : value         Lower 90%    Upper 90%
kT1 [keV]   : 8.51487        (-0.477207      0.500404)
R1^2/D10^2  : 0.541563        (-0.0958776      0.121475)
kT2 [keV]   : 35.8812        (-2.0422      2.42956)
R2^2/D10^2  : 5.46338E-03    (-0.00104812   0.00117671)
------------------------------------------------------------
#Fit statistic : Chi-Squared =          54.76 using 59 PHA bins.
# Reduced chi-squared =         0.9956 for     55 degrees of freedom
# Null hypothesis probability =   4.839305e-01

Energy  Fluence     90% Error
[keV]   [erg/cm2]   [erg/cm2]
15- 25  8.229e-06   4.871e-07
25- 50  2.047e-05   5.543e-07
50-150  5.711e-05   1.643e-06
15-150  8.581e-05   1.761e-06
Peak spectrum fit
Power-law model

Time interval is from   10.936 sec. to   11.936 sec.

Spectral model in power-law:
------------------------------------------------------------
Parameters  : value       lower 90%   higher 90%
Photon index: 1.02558     ( -0.0633522   0.0631034 )
Norm@50keV  : 0.588910    ( -0.0220061   0.0219957 )
------------------------------------------------------------
#Fit statistic : Chi-Squared =          74.42 using 59 PHA bins.
# Reduced chi-squared =          1.306 for     57 degrees of freedom
# Null hypothesis probability =   6.045939e-02

Photon flux (15-150 keV)    in 1 sec: 67.9024 ( -2.58087  2.58154 ) ph/cm2/s
Energy fluence (15-150 keV)             : 6.31156e-06 ( -2.59271e-07  2.59567e-07 ) ergs/cm2
Cutoff power-law model

Time interval is from   10.936 sec. to   11.936 sec.
Spectral model in the cutoff power-law:
------------------------------------------------------------
Parameters  : value       lower 90%   higher 90%
Photon index: 0.663509     ( -0.266226   0.251136 )
Epeak [keV] : 214.739      ( -66.7397 321.716 )
Norm@50keV  : 0.853391    ( -0.189165   0.25844 )
------------------------------------------------------------
#Fit statistic : Chi-Squared =          68.22 using 59 PHA bins.
# Reduced chi-squared =          1.218 for     56 degrees of freedom
# Null hypothesis probability =   1.267865e-01

Photon flux (15-150 keV)    in 1 sec: 67.1509 ( -2.6298  2.6306 ) ph/cm2/s
Energy fluence (15-150 keV)             : 6.36708e-07 ( -1.66673e-07  1.60607e-07 ) ergs/cm2
Band function

Time interval is from   10.936 sec. to   11.936 sec.


Spectral model in the Band function:
------------------------------------------------------------
Parameters  : value       lower 90%   higher 90%
alpha       :    (     )
beta        :     (     )
Epeak [keV] :       (   )
Norm@50keV   :     (     )
------------------------------------------------------------

Photon flux (15-150 keV)    in  sec:  (    ) ph/cm2/s
Energy fluence (15-150 keV)             : 0 ( 0  0 ) ergs/cm2
Single BB
Spectral model blackbody:
------------------------------------------------------------
Parameters  : value    Lower 90%  Upper 90%
kT [keV]    : 21.6557  (  )
R^2/D10^2   : 2.59343  (   )
(R is the radius in km and D10 is the distance to the source in units of 10 kpc)
------------------------------------------------------------
#Fit statistic : Chi-Squared =         175.74 using 59 PHA bins.
# Reduced chi-squared =         3.0832 for     57 degrees of freedom
# Null hypothesis probability =   4.956406e-14

Energy  Fluence     90% Error
[keV]   [erg/cm2]   [erg/cm2]
15- 25  2.267e-07   1.665e-08
25- 50  1.188e-06   6.450e-08
50-150  4.159e-06   2.745e-07
15-150  5.573e-06   2.460e-07
Thermal bremsstrahlung (OTTB)
Spectral model: thermal bremsstrahlung
------------------------------------------------------------
Parameters  : value         Lower 90%    Upper 90%
kT [keV]    : 199.363       (      )
Norm        : 272.923       (     )
------------------------------------------------------------
#Fit statistic : Chi-Squared =         251.47 using 59 PHA bins.
# Reduced chi-squared =         4.4118 for     57 degrees of freedom
# Null hypothesis probability =   2.992693e-26

Energy  Fluence     90% Error
[keV]   [erg/cm2]   [erg/cm2]
15- 25  6.796e-07   3.000e-08
25- 50  1.307e-06   5.350e-08
50-150  2.867e-06   1.190e-07
15-150  4.854e-06   2.090e-07
Double BB
Spectral model: bbodyrad<1> + bbodyrad<2>
------------------------------------------------------------
Parameters  : value         Lower 90%    Upper 90%
kT1 [keV]   : 9.20941        (-1.51113      1.73557)
R1^2/D10^2  : 20.0176        (-7.40948      13.6814)
kT2 [keV]   : 35.6286        (-4.89939      8.16761)
R2^2/D10^2  : 0.449843    (-0.215559   0.286656)
------------------------------------------------------------
#Fit statistic : Chi-Squared =          67.11 using 59 PHA bins.
# Reduced chi-squared =          1.220 for     55 degrees of freedom
# Null hypothesis probability =   1.268156e-01

Energy  Fluence     90% Error
[keV]   [erg/cm2]   [erg/cm2]
15- 25  4.142e-07   6.830e-08
25- 50  1.262e-06   1.475e-07
50-150  4.620e-06   6.335e-07
15-150  6.296e-06   7.710e-07
Plot creation:
Sat Jul 21 12:46:38 EDT 2018