Analysis for Ground-detected GRB: Trigger=848489
Analysis Summary
Notes:
- 1) No attempt has been made to eliminate the non-significant decimal places.
- 2) This is a special analysis for ground-detected GRB. The event data duration is likely to be shorter than the burst duration. In such cases, the burst durations are found using the quad-rate data, and spectral analyses are only available for event data range.
- 3) Some mask-weighted light curve plots might be missing because the time range is not completely covered by the event data range.
==========================================================================
           BAT GROUND-DETECTED GRB DATA PROCESSING REPORT
    Process Script Ver: batgrbproduct v2.46
    Process Start Time: Wed Jul 18 16:04:59 EDT 2018
             Host Name: bat1
   Current Working Dir: /local/data/bat1/alien/Swift_3rdBATcatalog/event/ground_detect_bursts/scripts
======================================================================

  Trigger: 00848489      Segment: 000

  BAT Trigger Time: 553571885.816
               UTC: 20180718T01:57:44.530   [includes UTCF correction]
       Where From?: Ground analysis (best_duration.txt)
  NOTE: BAT trigger time for ground-detected burst is the T100 start time.

  Analysis Position:   [ source = GCN ]
    RA: 336.0186   Dec: 2.78980

  Refined Position:   [ source = BAT pre-slew image ]
    RA: 336.019   Dec: 2.7898  [deg; J2000]
        { 22h 24m 04.6s , +02d 47' 23.3" }
        +/- 3.00825676649 [arcmin] (estimated 90% radius based on SNR)
    SNR: 6.30765882123

  Angular difference between the GCN position (ra=357.7188, dec=25.5838 deg) and this refined position is 0.001 arcmin

  Partial Coding Fraction: 0.25    [ including projection effects ]

  Duration
     T90: 0.0839999914169312 +/- 0.0233238752907961
        Measured from: 0.00800002
                   to: 0.092     [s; relative to TRIGTIME]
     T50: 0.0519999265670776 +/- 0.0256125023115591
        Measured from: 0.016
                   to: 0.068     [s; relative to TRIGTIME]

=== Fluence/Peak Flux Summary ===

              Model    Band1    Band2    Band3    Band4    Band5    Total
                       15-25    25-50   50-100  100-350   15-150   15-350   keV
Fluence   Power-law 2.94e-09 8.58e-10 1.36e-10 2.48e-11 3.95e-09 3.96e-09   erg/cm2
              Error 1.99e-09 5.11e-10 9.77e-11 2.53e-11 2.52e-09 2.52e-09   erg/cm2
Peak flux Power-law 3.82e-01 3.31e-01 1.96e-01 1.74e-01 9.83e-01 1.08e+00   ph/cm2/s
              Error 1.73e-01 1.04e-01 8.47e-02 1.44e-01 3.09e-01 3.42e-01   ph/cm2/s

Fluence   Cutoff-PL 2.32e-09 1.10e-08 2.34e-09 1.94e-12 1.56e-08 1.56e-08   erg/cm2
              Error 2.76e-09 4.68e-09 -------- 2.92e-12 5.49e-09 5.50e-09   erg/cm2
Peak flux Cutoff-PL 3.43e-01 3.78e-01 2.02e-01 5.32e-02 9.62e-01 9.75e-01   ph/cm2/s
              Error 1.92e-01 1.48e-01 1.53e-01 1.16e-01 3.14e-01 3.54e-01   ph/cm2/s

Fluence        Band -------- -------- -------- -------- -------- --------   erg/cm2
              Error -------- -------- -------- -------- -------- --------   erg/cm2
Peak flux      Band -------- -------- -------- -------- -------- --------   ph/cm2/s
              Error -------- -------- -------- -------- -------- --------   ph/cm2/s
=== Time-averaged spectral analysis ===

Model Ph_index Ph_90err Epeak  Epeak_90err Norm     Nomr_90err chi2   dof
PL    4.657    0.755    -      -           1.07e-03 7.05e-04   82.090 57
CPL   1.000    0.000      80.0    0.0      2.10e-04 0.00e+00   88.450 56


=== 1-s peak spectral analysis ===

Model Ph_index Ph_90err Epeak  Epeak_90err Norm     Nomr_90err chi2   dof
PL    1.757    0.521    -      -           7.25e-03 2.53e-03   58.080 57
CPL   0.689    3.189      53.9   -2.2      2.90e-02 1.68e+01   57.300 56

Model      : spectral model: simple power-law (PL) and cutoff power-law (CPL)
Ph_index   : photon index: E^-{Ph_index} (minus sign is not included in the index)
Ph_90err   : 90% error of the photon index
Epeak      : Epeak in keV
Epeak_90err: 90% error of Epeak
Norm       : normalization at 50 keV in PL model and at 1 keV in CPL model
Nomr_90err : 90% error of the normalization
chi2       : Chi-Squared
dof        : degree of freedom
=== Table of the duration information ==

        Value   tstart    tstop
T100    0.100    0.000    0.100
T90     0.084    0.008    0.092
T50     0.052    0.016    0.068
Peak    1.000   -0.448    0.552
Image
15.0-150.0 keV image (Event data)
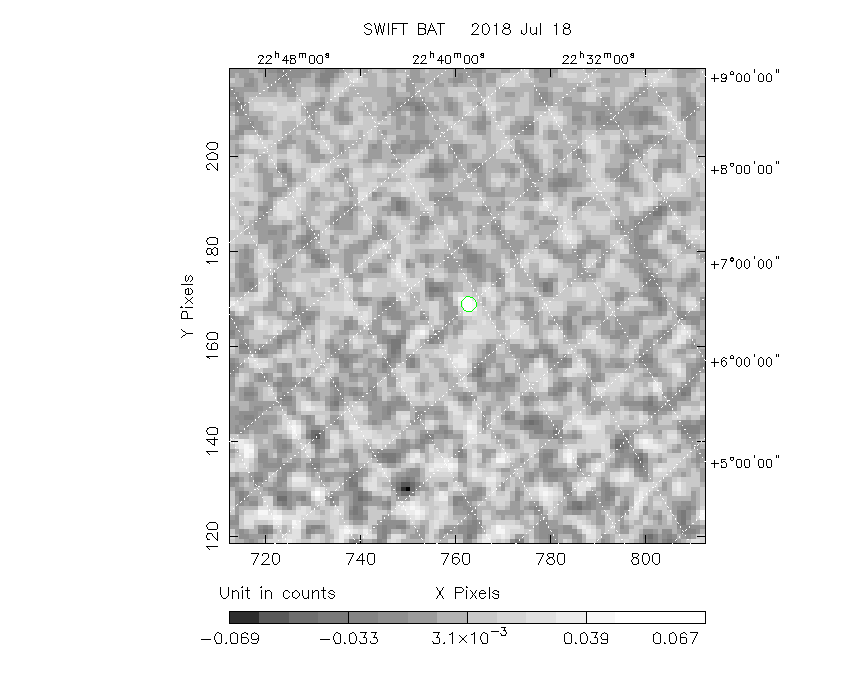
#RAcent DECcent POSerr Theta  Phi  Peak_Cts  SNR Name
336.019 2.790 0.000 34.670 69.207 0.079 6.308 TRIG_00848489

Image time interval: -0.026 to +0.165 [sec]
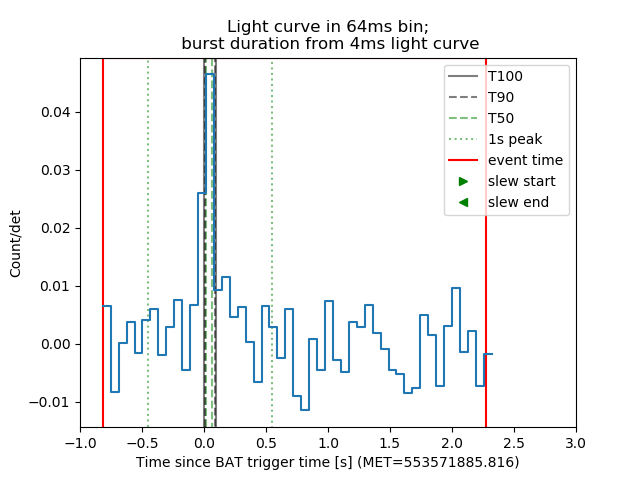
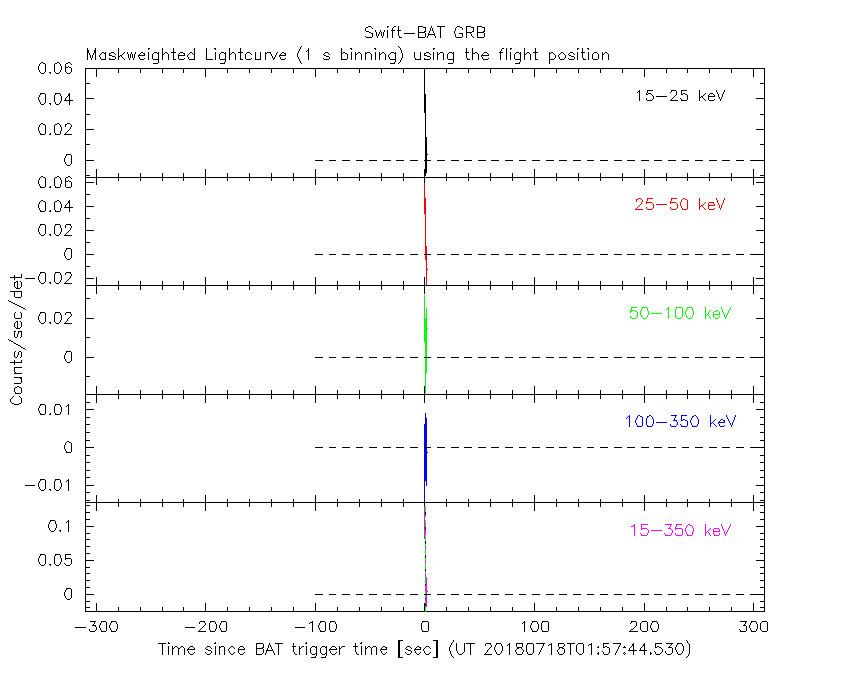
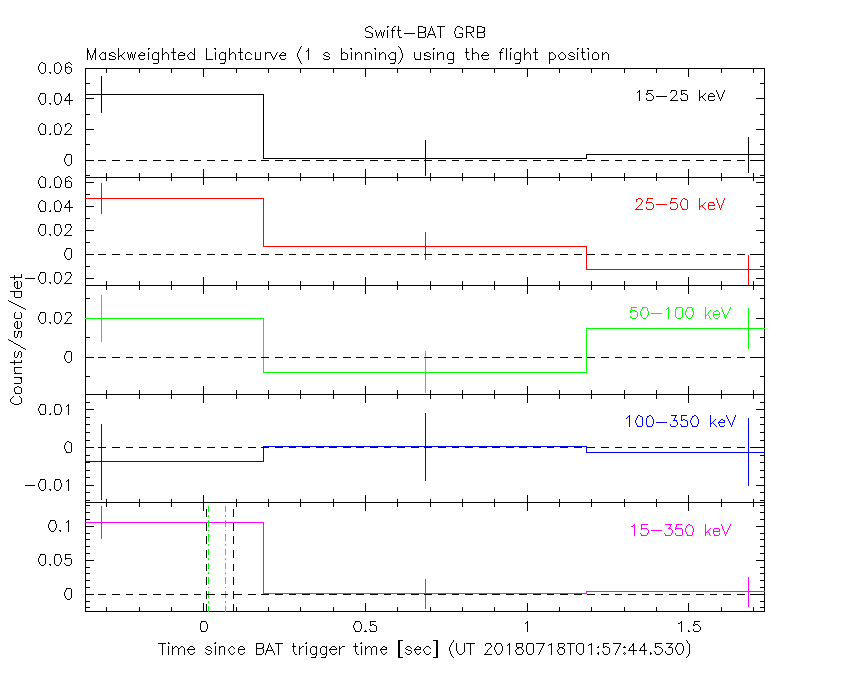
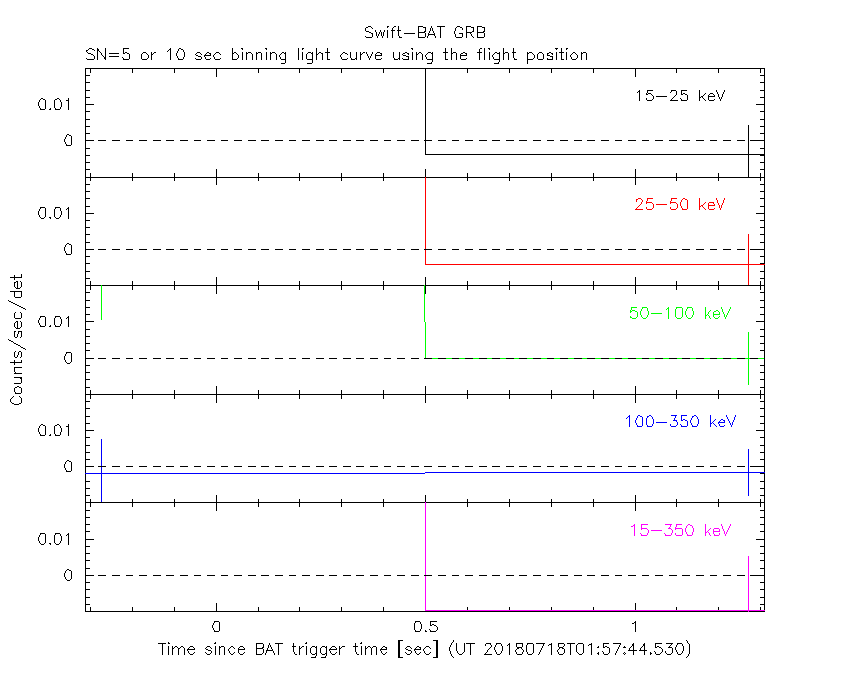
Lightcurves
Notes:
- 1) The mask-weighted lightcurves have units of either count/det or counts/sec/det, where a det is 0.4 x 0.4 = 0.16 sq cm.
- 2) The verticle lines correspond to following: green dotted lines are T50 interval, black dotted lines are T90 interval, blue solid line(s) is a spacecraft slew start time, and orange solid line(s) is a spacecraft slew end time (for the best duration plot, slew times are marked by green arrows).
- 3) For lightcurves in unit of count rate, time of each bin is in the middle of the bin.
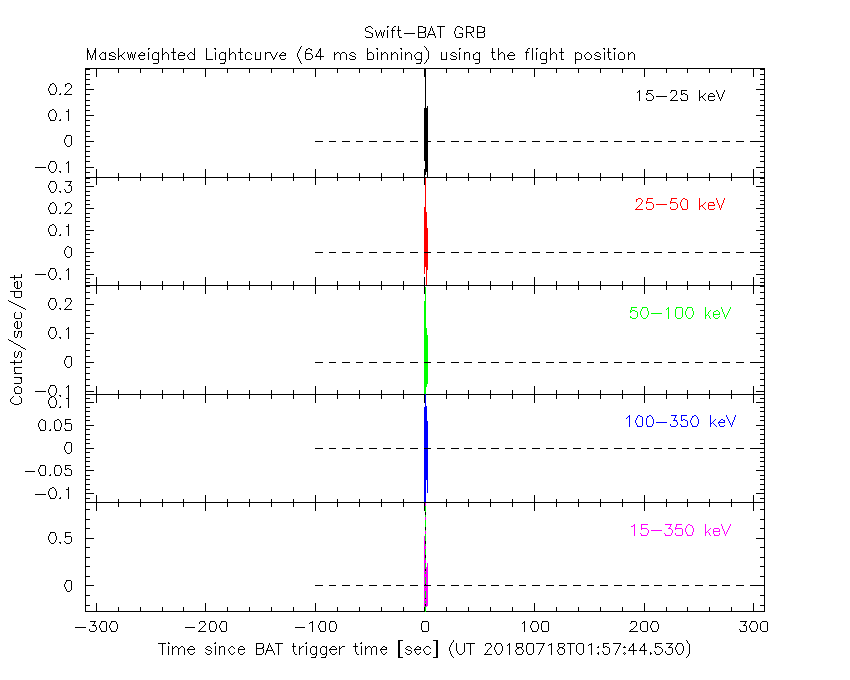
Best duration plot
1 s binning
From T0-310 s to T0+310 s
From T100_start - 20 s to T100_end + 30 s

Full time interval
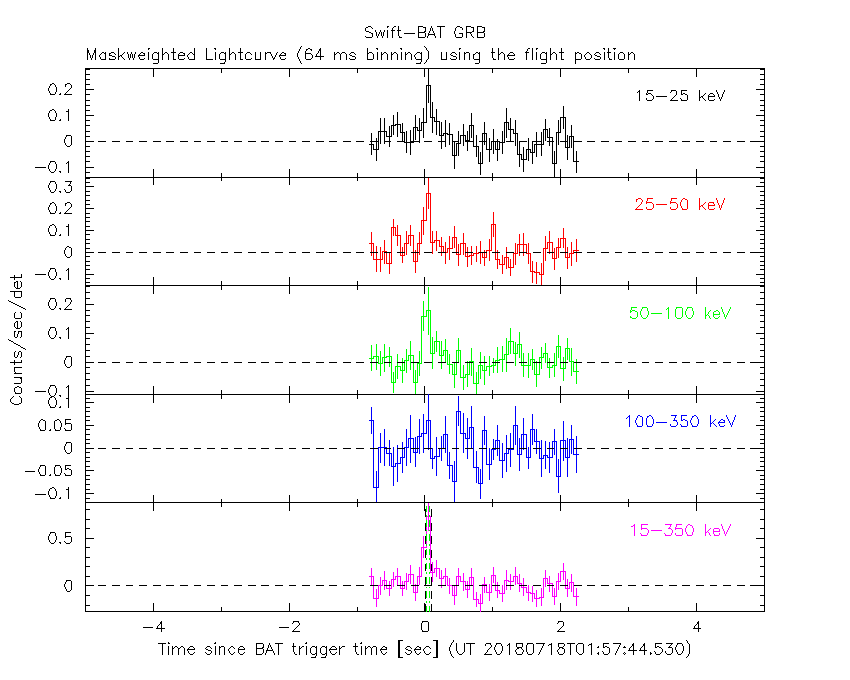
64 ms binning
Full time interval
From T100_start to T100_end

From T0-5 sec to T0+5 sec
16 ms binning
From T100_start-5 s to T100_start+5 s

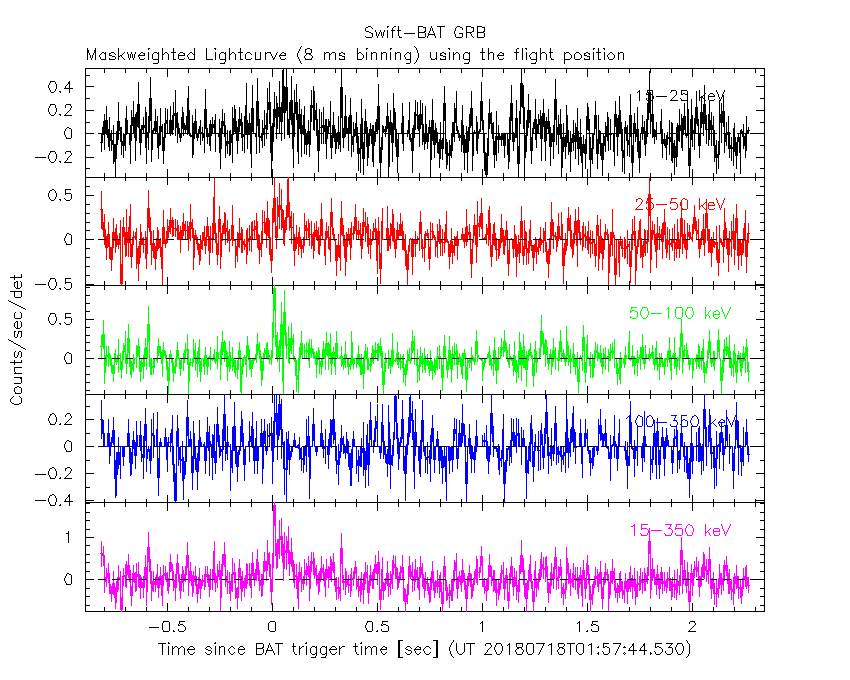
8 ms binning
From T100_start-3 s to T100_start+3 s
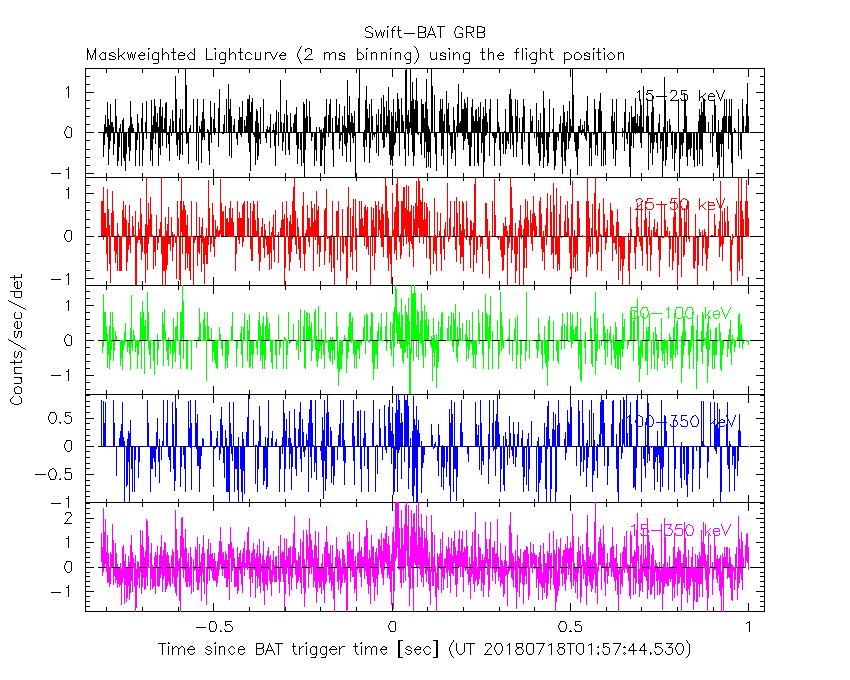
2 ms binning
From T100_start-1 s to T100_start+1 s
SN=5 or 10 sec. binning (whichever binning is satisfied first)
SN=5 or 10 sec. binning (T < 200 sec)

Spectral Evolution

Spectra
Notes:
- 1) The fitting includes the systematic errors.
- 2) For long bursts, a spectral fit of the pre-slew DRM will introduce some errors in both a spectral shape and a normalization if the PHA file contains a lot of the slew/post-slew time interval.
- 3) For fits to more complicated models (e.g. a power-law over a cutoff power-law), the BAT team has decided to require a chi-square improvement of more than 6 for each extra dof.
- 4) For short bursts (T90<1sec), the specrtum is also fit with Blackbody, OTTB, and Double Blackbody.
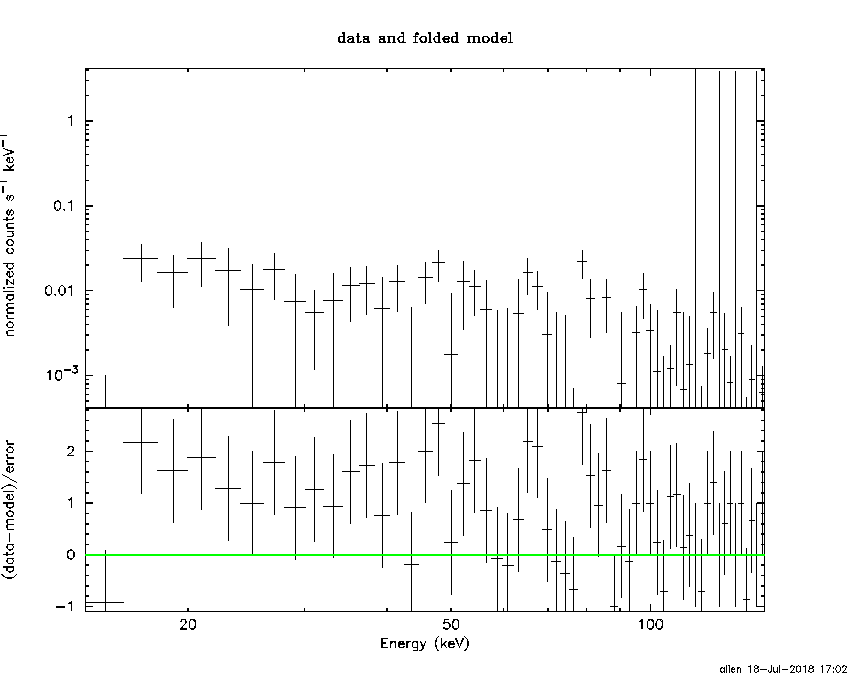
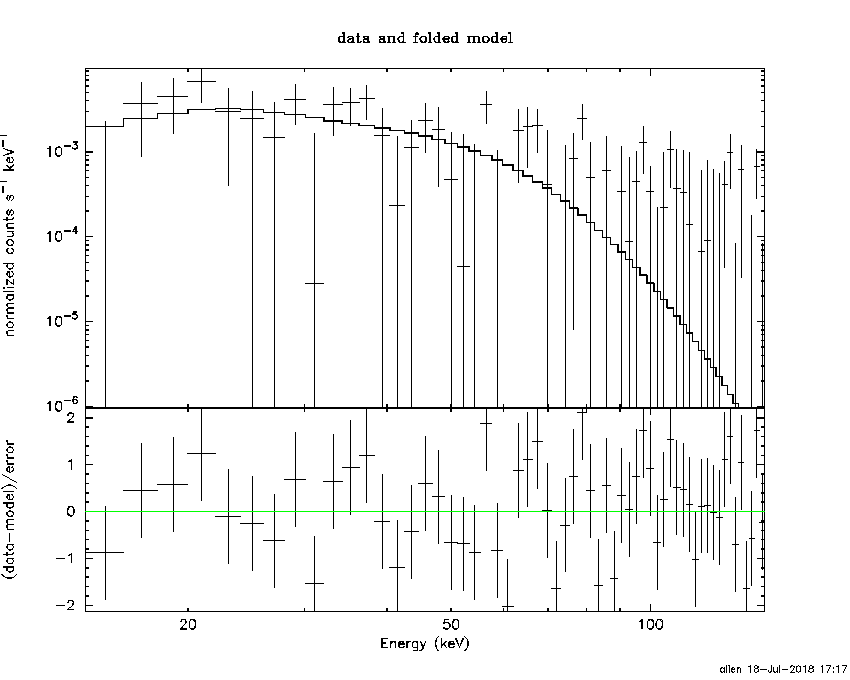
Time averaged spectrum fit using the pre-slew DRM
Power-law model

Time interval is from    0.000 sec. to    0.100 sec.

Spectral model in power-law:
------------------------------------------------------------
Parameters  : value       lower 90%   higher 90%
Photon index: 4.65650     ( -0.676788   0.833737 )
Norm@50keV  : 1.07159E-03    ( -0.000719191   0.000691525 )
------------------------------------------------------------
#Fit statistic : Chi-Squared =          82.09 using 59 PHA bins.
# Reduced chi-squared =          1.440 for     57 degrees of freedom
# Null hypothesis probability =   1.642924e-02

Photon flux (15-150 keV)    in 0.1 sec: 1.19595 ( -0.785305  0.78978 ) ph/cm2/s
Energy fluence (15-150 keV)             : 3.94903e-09 ( -2.51948e-09  2.51674e-09 ) ergs/cm2
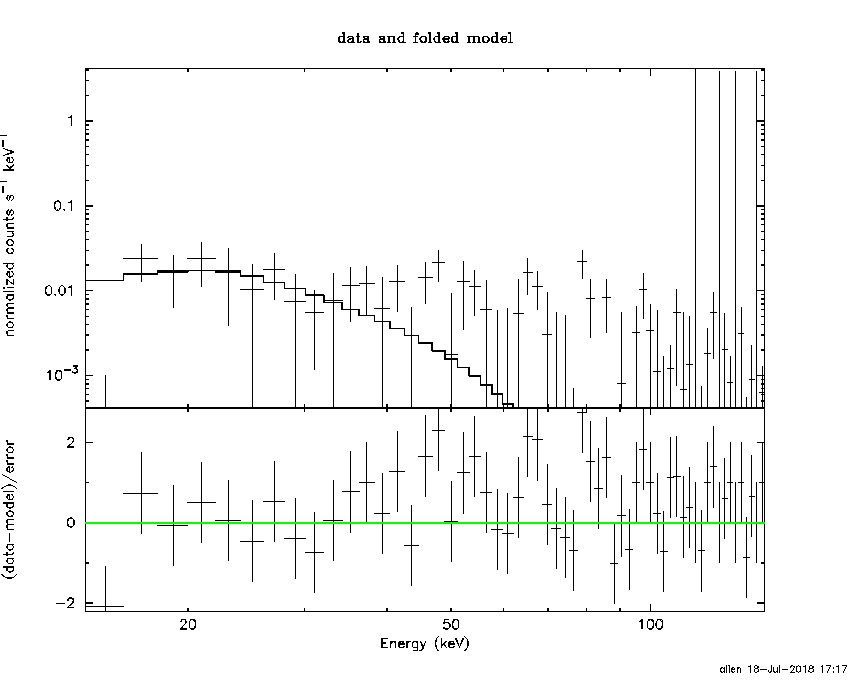
Cutoff power-law model
Time interval is from    0.000 sec. to    0.100 sec.
Spectral model in the cutoff power-law:
------------------------------------------------------------
Parameters  : value       lower 90%   higher 90%
Photon index: 1.00000     (     )
Epeak [keV] : 80.0000      (   )
Norm@50keV  : 2.09740E-04    (     )
------------------------------------------------------------
#Fit statistic : Chi-Squared =          88.45 using 59 PHA bins.
# Reduced chi-squared =          1.580 for     56 degrees of freedom
# Null hypothesis probability =   3.697836e-03

Photon flux (15-150 keV)    in 0.1 sec:  (    ) ph/cm2/s
Energy fluence (15-150 keV)             : 1.56236e-08 ( -5.04008e-09  5.94341e-09 ) ergs/cm2
Band function

Time interval is from    0.000 sec. to    0.100 sec.


Spectral model in the Band function:
------------------------------------------------------------
Parameters  : value       lower 90%   higher 90%
alpha       :    (     )
beta        :     (     )
Epeak [keV] :       (   )
Norm@50keV   :     (     )
------------------------------------------------------------

Photon flux (15-150 keV)    in  sec:  (    ) ph/cm2/s
Energy fluence (15-150 keV)             : 0 ( 0  0 ) ergs/cm2
Single BB
Spectral model blackbody:
------------------------------------------------------------
Parameters  : value    Lower 90%  Upper 90%
kT [keV]    : 6.73878  (-0.804494  0.548718)
R^2/D10^2   : 7.82043  (-3.66699   6.32673)
(R is the radius in km and D10 is the distance to the source in units of 10 kpc)
------------------------------------------------------------
#Fit statistic : Chi-Squared =          64.68 using 59 PHA bins.
# Reduced chi-squared =          1.135 for     57 degrees of freedom
# Null hypothesis probability =   2.263707e-01

Energy  Fluence     90% Error
[keV]   [erg/cm2]   [erg/cm2]
15- 25  5.475e-09   2.197e-09
25- 50  6.957e-09   2.294e-09
50-150  1.003e-09   5.045e-10
15-150  1.344e-08   4.811e-09
Thermal bremsstrahlung (OTTB)
Spectral model: thermal bremsstrahlung
------------------------------------------------------------
Parameters  : value         Lower 90%    Upper 90%
kT [keV]    : 13.1584       (-2.56537      2.23146)
Norm        : 51.5267       (-25.2283     33.4326)
------------------------------------------------------------
#Fit statistic : Chi-Squared =          73.18 using 59 PHA bins.
# Reduced chi-squared =          1.284 for     57 degrees of freedom
# Null hypothesis probability =   7.307816e-02

Energy  Fluence     90% Error
[keV]   [erg/cm2]   [erg/cm2]
15- 25  5.274e-09   2.269e-09
25- 50  3.161e-09   1.366e-09
50-150  4.256e-10   2.234e-10
15-150  8.861e-09   4.013e-09
Double BB

Spectral model: bbodyrad<1> + bbodyrad<2>
------------------------------------------------------------
Parameters  : value         Lower 90%    Upper 90%
kT1 [keV]   : 6.70894        (-0.804797      0.552108)
R1^2/D10^2  : 8.02102        (-3.66928      6.32862)
kT2 [keV]   : 0.209476        (-0.209476      -0.209476)
R2^2/D10^2  : 1.87267E-04    (-0.00018673   -0.00018673)
------------------------------------------------------------
#Fit statistic : Chi-Squared =          64.68 using 59 PHA bins.
# Reduced chi-squared =          1.176 for     55 degrees of freedom
# Null hypothesis probability =   1.744335e-01

Energy  Fluence     90% Error
[keV]   [erg/cm2]   [erg/cm2]
15- 25  5.538e-09   2.335e-09
25- 50  6.975e-09   3.103e-09
50-150  9.888e-10   4.956e-10
15-150  1.350e-08   5.755e-09
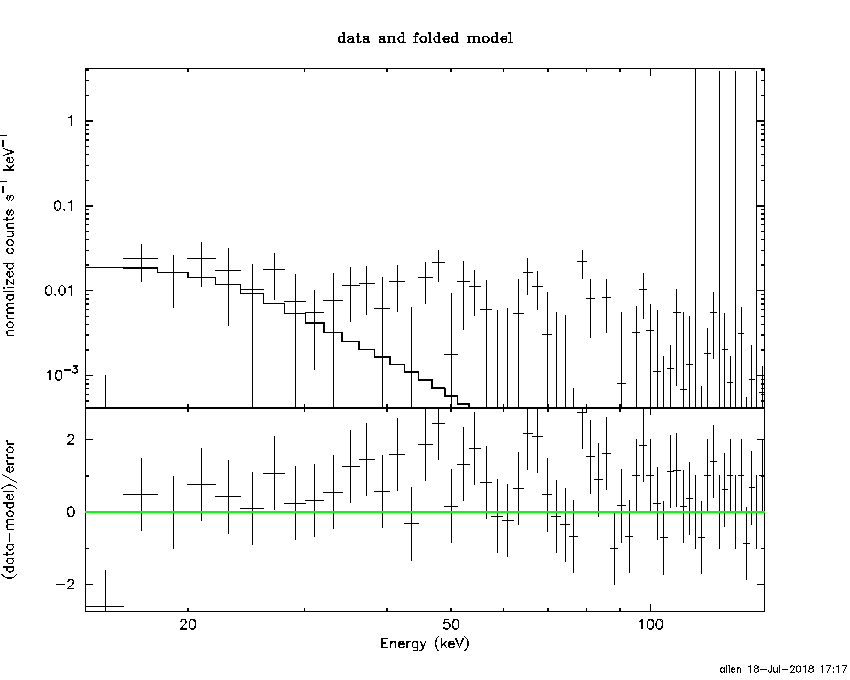
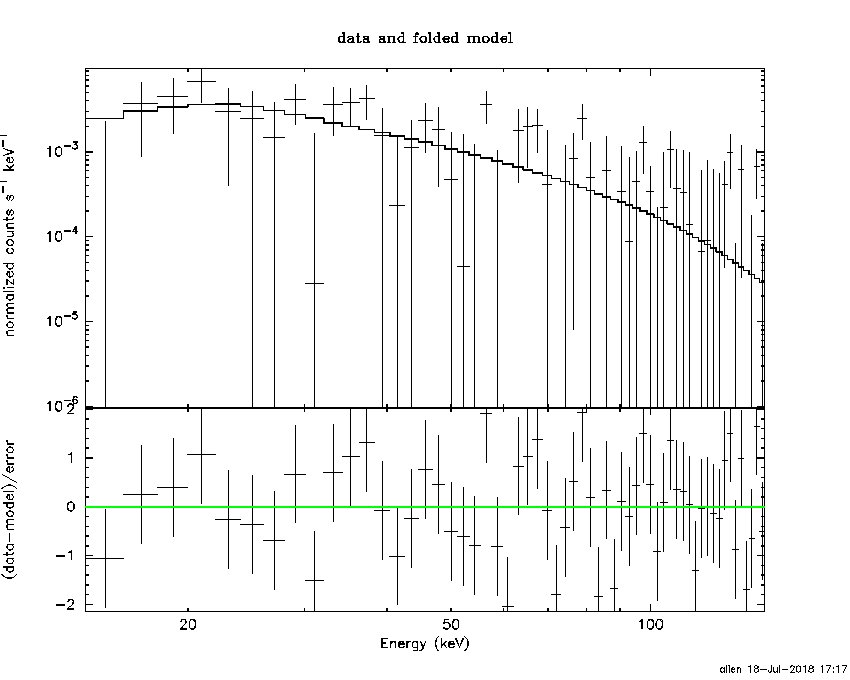
Peak spectrum fit
Power-law model

Time interval is from   -0.448 sec. to    0.552 sec.

Spectral model in power-law:
------------------------------------------------------------
Parameters  : value       lower 90%   higher 90%
Photon index: 1.75694     ( -0.492331   0.549084 )
Norm@50keV  : 7.25453E-03    ( -0.00257286   0.00247763 )
------------------------------------------------------------
#Fit statistic : Chi-Squared =          58.08 using 59 PHA bins.
# Reduced chi-squared =          1.019 for     57 degrees of freedom
# Null hypothesis probability =   4.353983e-01

Photon flux (15-150 keV)    in 1 sec: 0.983499 ( -0.309243  0.309631 ) ph/cm2/s
Energy fluence (15-150 keV)             : 6.69268e-08 ( -2.34958e-08  2.42701e-08 ) ergs/cm2
Cutoff power-law model

Time interval is from   -0.448 sec. to    0.552 sec.
Spectral model in the cutoff power-law:
------------------------------------------------------------
Parameters  : value       lower 90%   higher 90%
Photon index: 0.688847     ( -4.88613   1.4909 )
Epeak [keV] : 53.9330      ( -49.5157 -53.9309 )
Norm@50keV  : 2.89871E-02    ( -0.0289904   33.5399 )
------------------------------------------------------------
#Fit statistic : Chi-Squared =          57.30 using 59 PHA bins.
# Reduced chi-squared =          1.023 for     56 degrees of freedom
# Null hypothesis probability =   4.268534e-01

Photon flux (15-150 keV)    in 1 sec: 0.962432 ( -0.314628  0.313218 ) ph/cm2/s
Energy fluence (15-150 keV)             : 5.60544e-08 ( -5.41312e-08  2.39567e-08 ) ergs/cm2
Band function

Time interval is from   -0.448 sec. to    0.552 sec.


Spectral model in the Band function:
------------------------------------------------------------
Parameters  : value       lower 90%   higher 90%
alpha       :    (     )
beta        :     (     )
Epeak [keV] :       (   )
Norm@50keV   :     (     )
------------------------------------------------------------

Photon flux (15-150 keV)    in  sec:  (    ) ph/cm2/s
Energy fluence (15-150 keV)             : 0 ( 0  0 ) ergs/cm2
Single BB
Spectral model blackbody:
------------------------------------------------------------
Parameters  : value    Lower 90%  Upper 90%
kT [keV]    : 10.8727  (-3.35226  5.45948)
R^2/D10^2   : 0.356584  (-0.355971   1.04502)
(R is the radius in km and D10 is the distance to the source in units of 10 kpc)
------------------------------------------------------------
#Fit statistic : Chi-Squared =          58.48 using 59 PHA bins.
# Reduced chi-squared =          1.026 for     57 degrees of freedom
# Null hypothesis probability =   4.209004e-01

Energy  Fluence     90% Error
[keV]   [erg/cm2]   [erg/cm2]
15- 25  8.786e-09   5.490e-09
25- 50  2.447e-08   1.503e-08
50-150  1.620e-08   1.185e-08
15-150  4.946e-08   3.054e-08
Thermal bremsstrahlung (OTTB)

Spectral model: thermal bremsstrahlung
------------------------------------------------------------
Parameters  : value         Lower 90%    Upper 90%
kT [keV]    : 99.9056       (-62.2115      -101.221)
Norm        : 4.43969       (-1.5677     2.45497)
------------------------------------------------------------
#Fit statistic : Chi-Squared =          57.48 using 59 PHA bins.
# Reduced chi-squared =          1.008 for     57 degrees of freedom
# Null hypothesis probability =   4.572453e-01

Energy  Fluence     90% Error
[keV]   [erg/cm2]   [erg/cm2]
15- 25  1.160e-08   7.190e-09
25- 50  2.006e-08   1.249e-08
50-150  3.249e-08   2.619e-08
15-150  6.416e-08   4.326e-08
Double BB
------------------------------------------------------------
Parameters  : value         Lower 90%    Upper 90%
kT1 [keV]   : 8.24101        (-7.69457      6.26443)
R1^2/D10^2  : 0.793203        (-0.804761      -0.804761)
kT2 [keV]   : 29.7770        (-29.5488      -29.5488)
R2^2/D10^2  : 4.74332E-03    (-0.00500704   0.782214)
------------------------------------------------------------
#Fit statistic : Chi-Squared =          56.72 using 59 PHA bins.
#Fit statistic : Chi-Squared =          56.67 using 59 PHA bins.
# Reduced chi-squared =          1.031 for     55 degrees of freedom
# Reduced chi-squared =          1.030 for     55 degrees of freedom
# Null hypothesis probability =   4.105512e-01
# Null hypothesis probability =   4.124320e-01

Energy  Fluence     90% Error
[keV]   [erg/cm2]   [erg/cm2]
15- 25  1.092e-08   7.160e-09
25- 50  2.205e-08   1.393e-08
50-150  3.087e-08   1.892e-08
15-150  6.384e-08   3.769e-08
Webpage updated on:
Wed Jul 18 17:17:37 EDT 2018