batgrbproduct analysis for trigger=802999
batgrbproduct Analysis for Trigger=802999
Analysis Summary
Notes:
- 1) No attempt has been made to eliminate the non-significant decimal places.
- 2) This batgrbproduct analysis is done of the amount of data for this trigger downloaded to date.
- 3) This batgrbproduct analysis is using the flight position for the mask-weighting calculation.
- 4) This page will be updated for up to 15 downlinks after the trigger.
======================================================================
                  BAT GRB EVENT DATA PROCESSING REPORT
    Process Script Ver: batgrbproduct v2.46
    Process Start Time (local time): Wed Jan  3 14:51:31 EST 2018
             Host Name: bat1
   Current Working Dir: /local/data/bat1/prebascript/trigger802999/GCN5_download_cron
======================================================================

  Trigger: 00802999      Segment: 000

  BAT Trigger Time: 536601004.544   [s; MET]
      Trigger Stop: 536601005.568   [s; MET]
               UTC: 2018-01-02T15:49:44.290400    [includes UTCF correction]
       Where From?: TDRSS position message

  BAT
    RA: 203.115129995838   Dec: 62.1481848328947  [deg; J2000]

     Catalogged Source?: NO
     Point Source?:      YES
     GRB Indicated?:     YES    [ by BAT flight software ]
     Image S/N Ratio:    7.37
     Image Trigger?:     NO
     Rate S/N Ratio:     11.8321595661992  [ if not an image trigger ]
     Image S/N Ratio:    7.37

  Flight Position:   [ source = BAT ]
    RA: 203.115129995838   Dec: 62.1481848328947  [deg; J2000]

  Ground Position:   [ source = BAT pre-slew burst ]
    RA: 203.078350843807   Dec: 62.160572473681  [deg; J2000]
        { 13h 32m 18.8s , +62d 09' 38.1" }
         +/- 1.46185006803731 [arcmin] (estimated 90% radius based on SNR)
         +/- 0.834857272635061 [arcmin] (formal 1-sigma fit error)
    SNR: 17.6824689964329

  Angular difference between Flight and Ground position is 1.270781 arcmin

  Partial Coding Fraction: 0.953125    [ including projection effects ]

  Duration
     T90: 10.8479999303818 +/- 1.72179558501115
        Measured from: -6.0919998884201
                   to: 4.75600004196167     [s; relative to TRIGTIME]
     T50: 3.96799999475479 +/- 1.85109692695779
        Measured from: -0.759999930858612
                   to: 3.20800006389618     [s; relative to TRIGTIME]


  Fluence
     Peak Flux  (peak 1 second)
        Measured from: 0.799999952316284
                   to: 1.79999995231628     [s; relative to TRIGTIME]
     Total Fluence
        Measured from: -7.6240000128746
                   to: 6.29999995231628     [s; relative to TRIGTIME]

             Band 1     Band 2     Band 3     Band 4
              15-25      25-50     50-100    100-350     keV
 Total     0.266545   0.264508   0.128770   0.033154
           0.020811   0.021659   0.018284   0.014919 [error]
 Peak      0.029292   0.044941   0.041533   0.011054
           0.005669   0.006097   0.005465   0.004227 [error]

     [ fluence units of on-axis counts / fully illuminated detector ]

======================================================================

=== Fluence/Peak Flux Summary ===

              Model    Band1    Band2    Band3    Band4    Band5    Total
                       15-25    25-50   50-100  100-350   15-150   15-350   keV
Fluence   Power-law 7.92e-08 1.07e-07 1.06e-07 1.89e-07 3.53e-07 4.81e-07   erg/cm2
              Error 1.06e-08 9.93e-09 1.77e-08 6.30e-08 4.00e-08 8.20e-08   erg/cm2
Peak flux Power-law 3.22e-01 3.29e-01 2.37e-01 2.74e-01 9.95e-01 1.16e+00   ph/cm2/s
              Error 7.51e-02 4.84e-02 4.41e-02 1.03e-01 1.40e-01 1.70e-01   ph/cm2/s

Fluence   Cutoff-PL 7.85e-08 1.08e-07 1.06e-07 1.55e-07 3.50e-07 4.47e-07   erg/cm2
              Error 1.14e-08 1.21e-08 1.84e-08 9.98e-08 4.58e-08 1.20e-07   erg/cm2
Peak flux Cutoff-PL 2.80e-01 3.52e-01 2.53e-01 1.30e-01 9.66e-01 1.01e+00   ph/cm2/s
              Error 9.59e-02 5.96e-02 5.16e-02 1.51e-01 1.48e-01 2.22e-01   ph/cm2/s

Fluence        Band -------- -------- -------- -------- -------- --------   erg/cm2
              Error -------- -------- -------- -------- -------- --------   erg/cm2
Peak flux      Band 2.80e-01 3.53e-01 2.52e-01 1.58e-01 9.65e-01 1.05e+00   ph/cm2/s
              Error -------- -------- -------- -------- -------- --------   ph/cm2/s
=== Time-averaged spectral analysis ===

Model Ph_index Ph_90err Epeak  Epeak_90err Norm     Nomr_90err chi2   dof
PL    2.012    0.184    -      -           2.75e-03 3.30e-04   51.540 57
CPL   1.910    0.480      37.3    0.0      3.15e-03 0.00e+00   51.470 56


=== 1-s peak spectral analysis ===

Model Ph_index Ph_90err Epeak  Epeak_90err Norm     Nomr_90err chi2   dof
PL    1.473    0.243    -      -           8.03e-03 1.18e-03   48.090 57
CPL   0.724    1.135      86.2  -28.2      1.90e-02 3.90e-02   46.680 56

Model      : spectral model: simple power-law (PL) and cutoff power-law (CPL)
Ph_index   : photon index: E^-{Ph_index} (minus sign is not included in the index)
Ph_90err   : 90% error of the photon index
Epeak      : Epeak in keV
Epeak_90err: 90% error of Epeak
Norm       : normalization at 50 keV in PL model and at 1 keV in CPL model
Nomr_90err : 90% error of the normalization
chi2       : Chi-Squared
dof        : degree of freedom
=== T90/T50 calculation in the 50-300 keV band (BATSE band) using 64 ms lc ===

T90 in the 50-300 keV band: 2.688000 sec.
T50 in the 50-300 keV band: 1.216000 sec.
=== Table of the duration information ==

        Value   tstart    tstop
T100   13.924   -7.624    6.300
T90    10.848   -6.092    4.756
T50     3.968   -0.760    3.208
Peak    1.000    0.800    1.800
Image
Pre-slew 15-350 keV image (Event data; bkg subtracted)
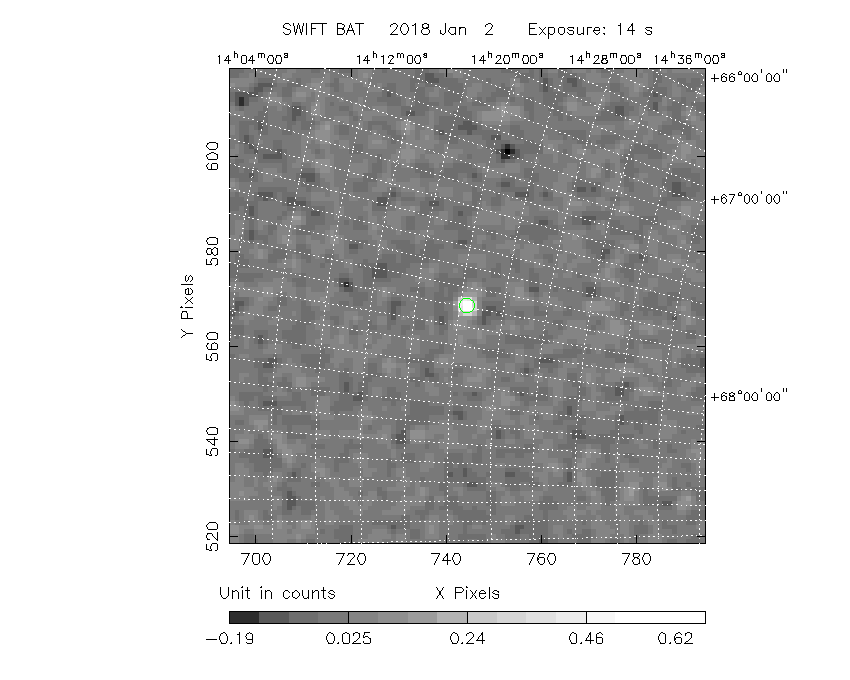
#   RAcent  DECcent POSerr  Theta    Phi     Peak Cts     SNR  Name
  203.0784 +62.1606 0.0109   19.0  -34.2       0.7247    17.7  TRIG_00802999
------------------------------------------

Foreground time interval of the image:
 -7.624   6.300 (delta_t =  13.924 [sec])
Background time interval of the image:
-60.544  -7.624 (delta_t =  52.920 [sec])
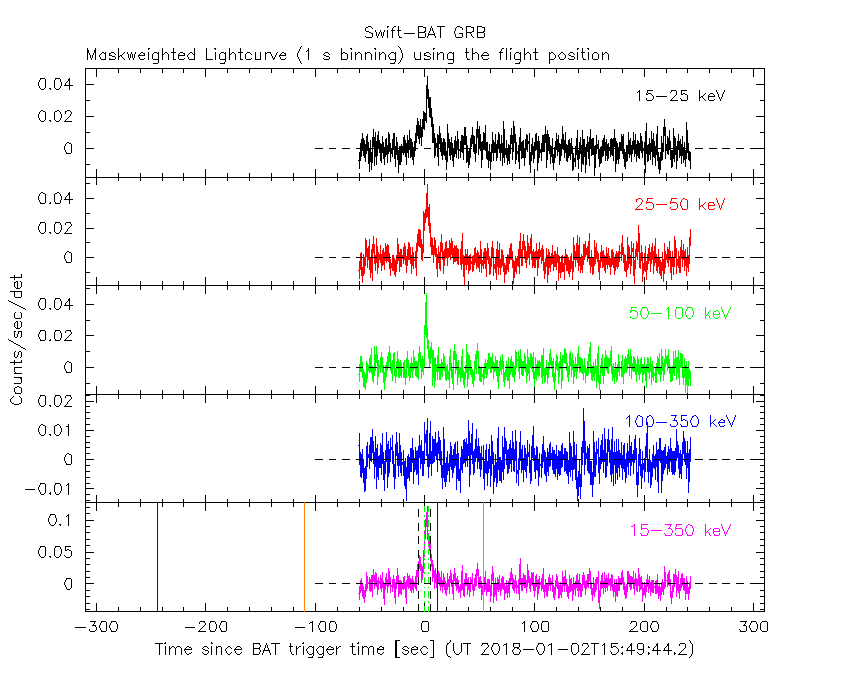
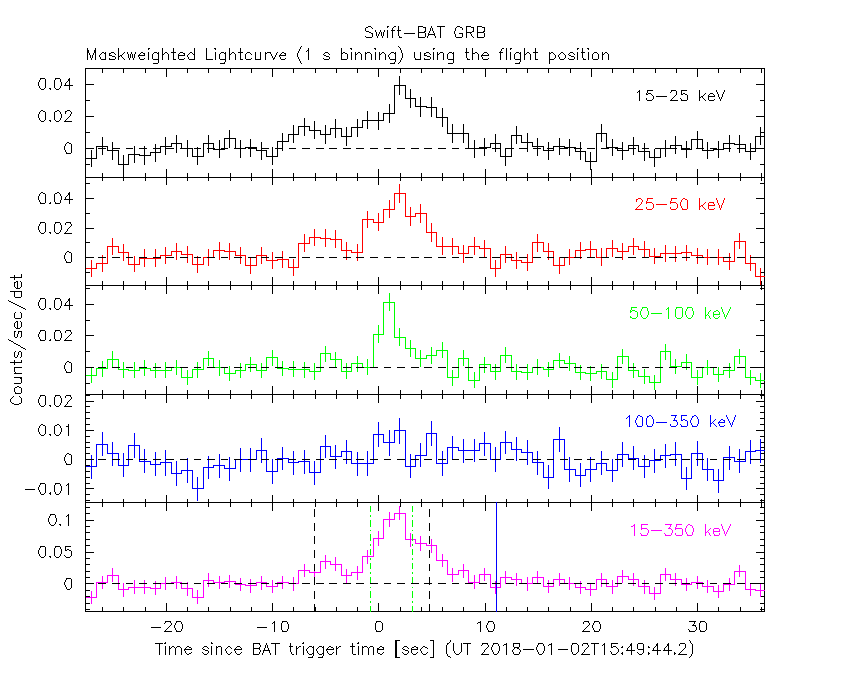
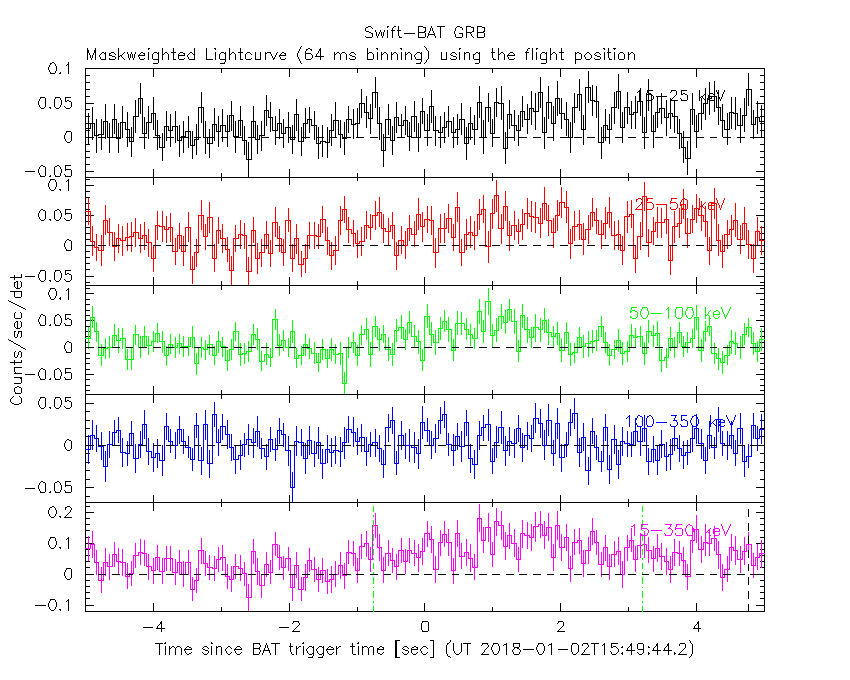
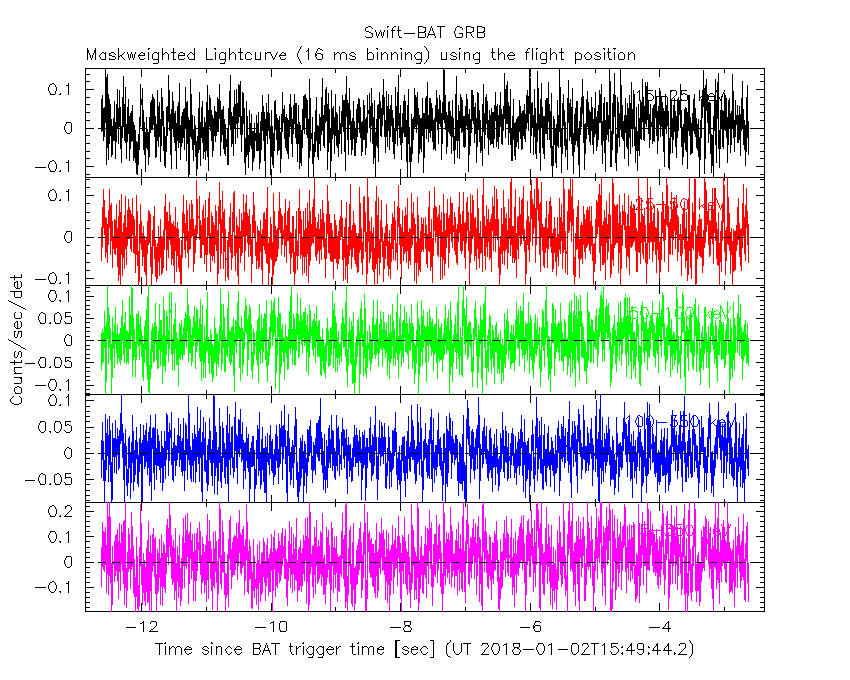
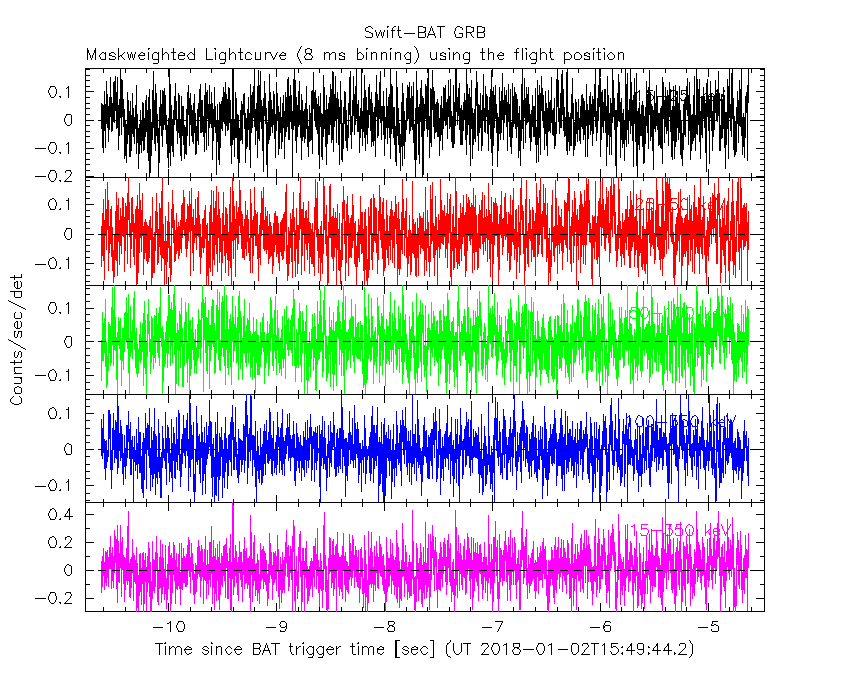
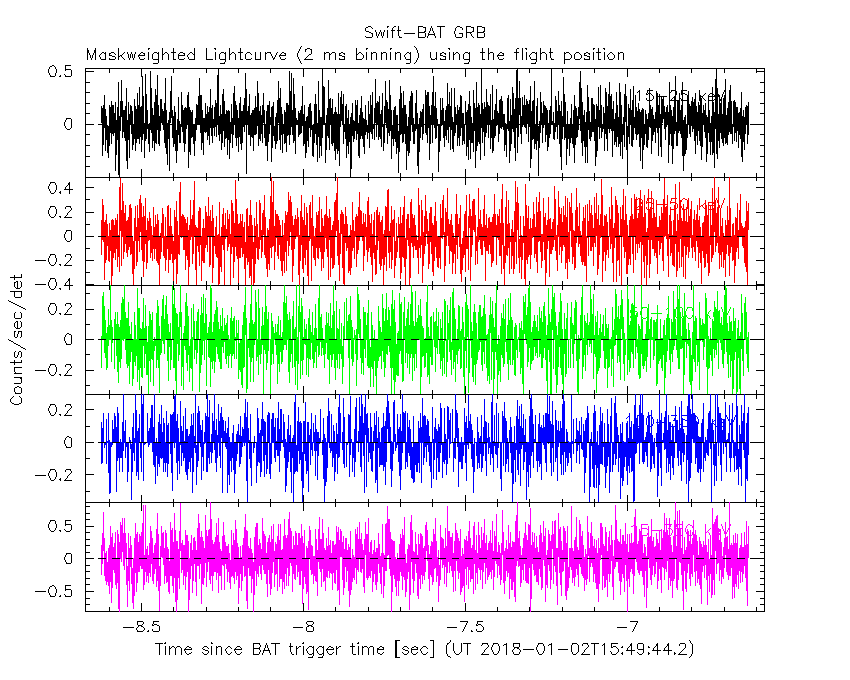
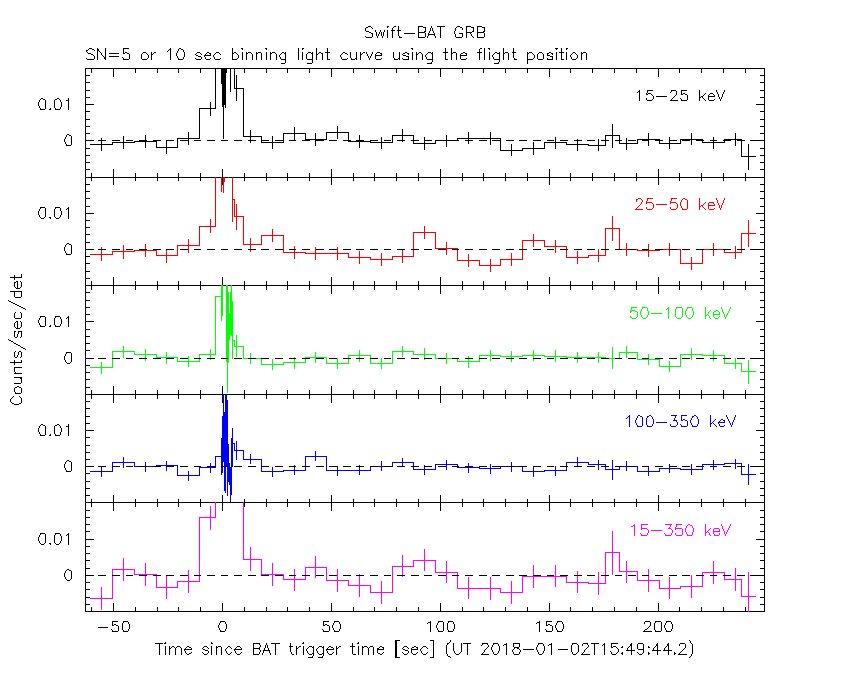
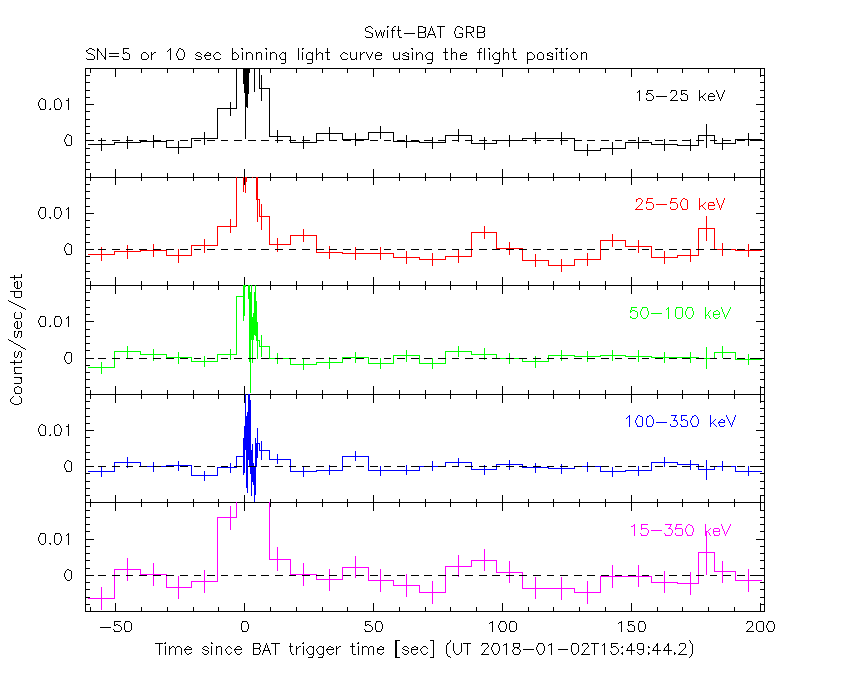
Lightcurves
Notes:
- 1) All plots contain as much data as has been downloaded to date.
- 2) The mask-weighted light curves are using the flight position.
- 3) Multiple plots of different time binning/intervals are shown to cover all scenarios of short/long GRBs, rate/image triggers, and real/false positives.
- 4) For all the mask-weighted lightcurves, the y-axis units are counts/sec/det where a det is 0.4 x 0.4 = 0.16 sq cm.
- 5) The verticle lines correspond to following: green dotted lines are T50 interval, black dotted lines are T90 interval, blue solid line(s) is a spacecraft slew start time, and orange solid line(s) is a spacecraft slew end time.
- 6) Time of each bin is in the middle of the bin.
1 s binning
From T0-310 s to T0+310 s
From T100_start - 20 s to T100_end + 30 s
Full time interval

64 ms binning
Full time interval

From T100_start to T100_end
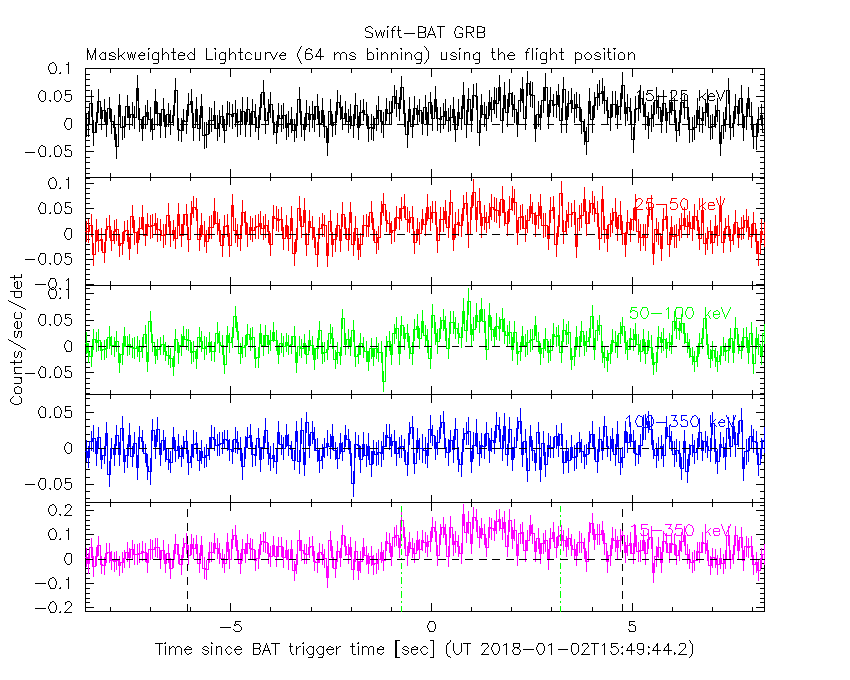
From T0-5 sec to T0+5 sec
16 ms binning
From T100_start-5 s to T100_start+5 s
8 ms binning
From T100_start-3 s to T100_start+3 s
2 ms binning
From T100_start-1 s to T100_start+1 s
SN=5 or 10 sec. binning (whichever binning is satisfied first)
SN=5 or 10 sec. binning (T < 200 sec)
Spectra
Notes:
- 1) The fitting includes the systematic errors.
- 2) For long bursts, a spectral fit of the pre-slew DRM will introduce some errors in both a spectral shape and a normalization if the PHA file contains a lot of the slew/post-slew time interval.
- 3) For fits to more complicated models (e.g. a power-law over a cutoff power-law), the BAT team has decided to require a chi-square improvement of more than 6 for each extra dof.
- 4) For short bursts (T90<1sec), the specrtum is also fit with Blackbody, OTTB, and Double Blackbody.
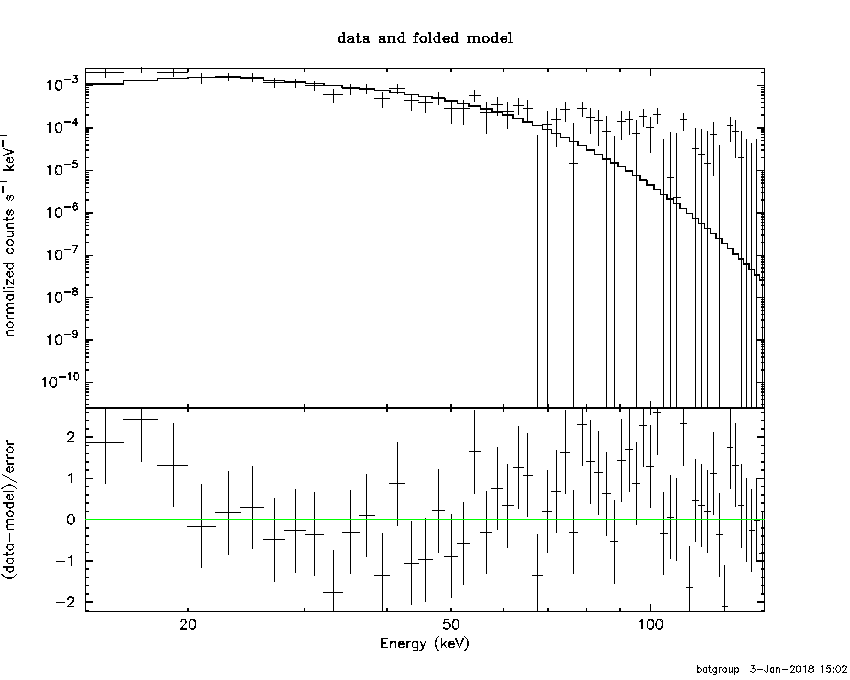
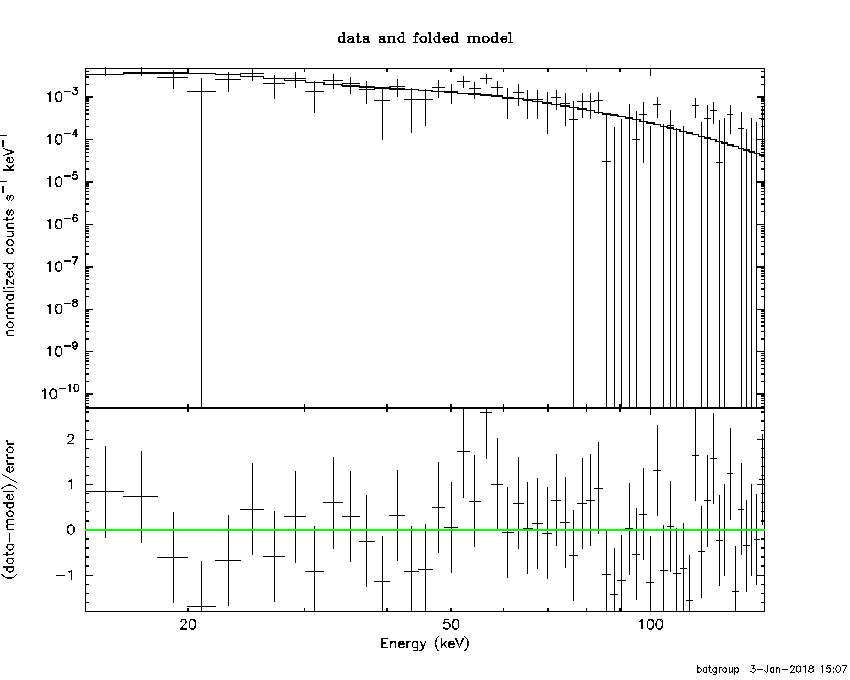
Time averaged spectrum fit using the pre-slew DRM
Power-law model
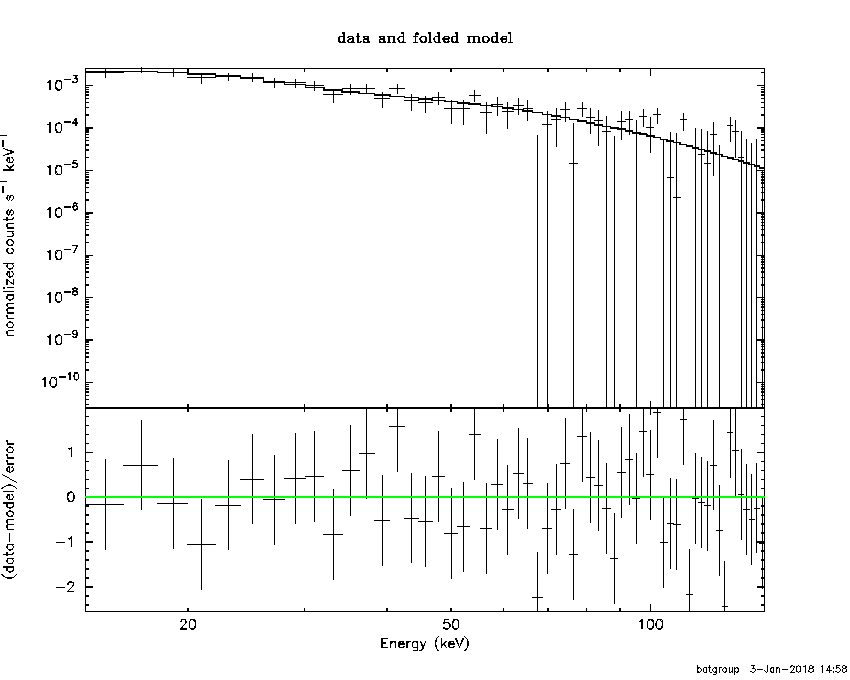
Time interval is from   -7.624 sec. to    6.300 sec.

Spectral model in power-law:
------------------------------------------------------------
Parameters  : value       lower 90%   higher 90%
Photon index: 2.01220     ( -0.179638   0.189072 )
Norm@50keV  : 2.75058E-03    ( -0.000333758   0.000325568 )
------------------------------------------------------------
#Fit statistic : Chi-Squared =          51.54 using 59 PHA bins.
# Reduced chi-squared =         0.9042 for     57 degrees of freedom
# Null hypothesis probability =   6.793160e-01

Photon flux (15-150 keV)    in 13.92 sec: 0.414918 ( -0.0383481  0.0383627 ) ph/cm2/s
Energy fluence (15-150 keV)             : 3.53326e-07 ( -3.95899e-08  4.03837e-08 ) ergs/cm2
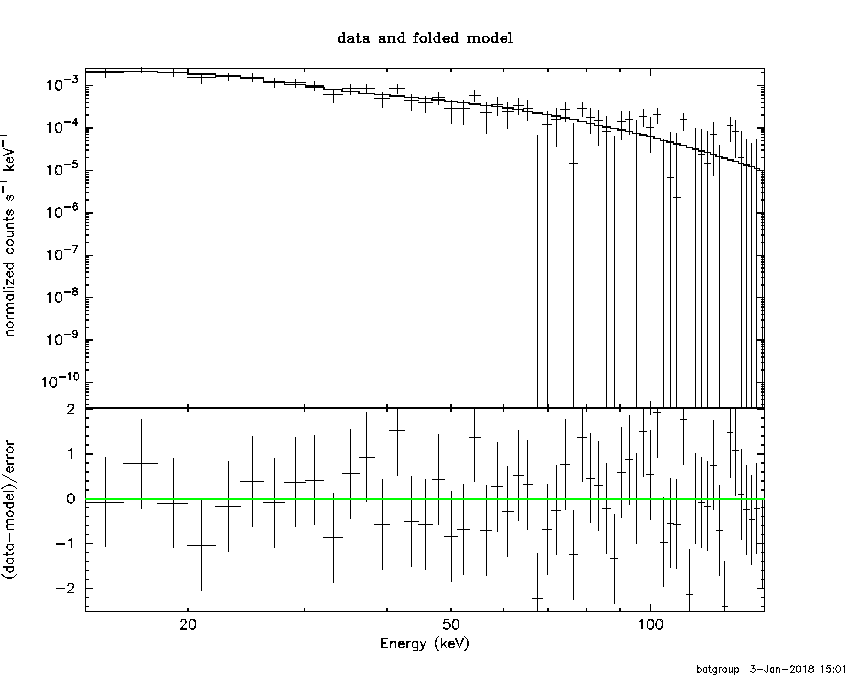
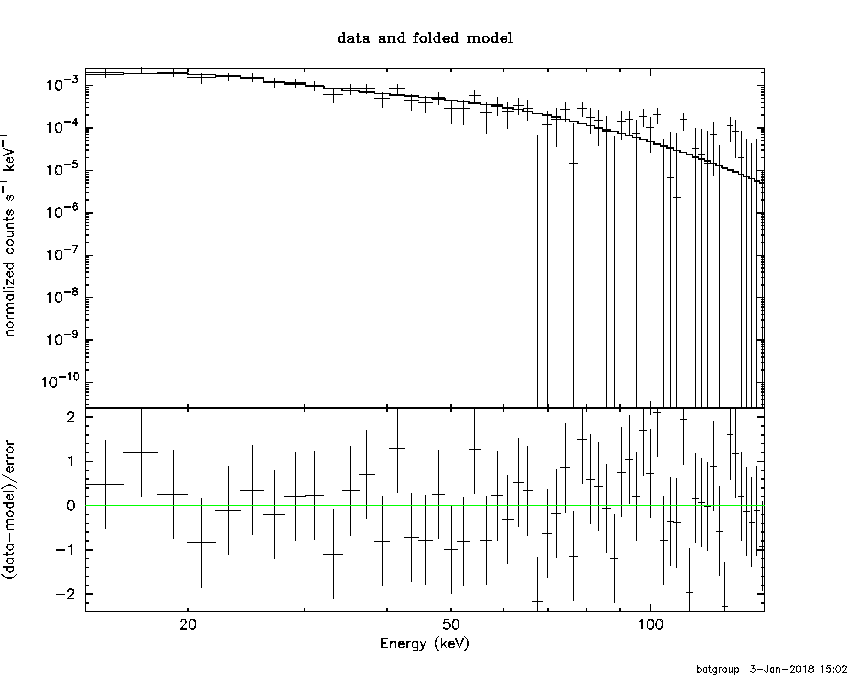
Cutoff power-law model

Time interval is from   -7.624 sec. to    6.300 sec.
Spectral model in the cutoff power-law:
------------------------------------------------------------
Parameters  : value       lower 90%   higher 90%
Photon index: 1.91030     ( -0.734409   0.224665 )
Epeak [keV] : 37.3363      (   )
Norm@50keV  : 3.14656E-03    (     )
------------------------------------------------------------
#Fit statistic : Chi-Squared =          51.47 using 59 PHA bins.
# Reduced chi-squared =         0.9191 for     56 degrees of freedom
# Null hypothesis probability =   6.468876e-01

Photon flux (15-150 keV)    in 13.92 sec: 0.413017 ( -0.040009  0.039562 ) ph/cm2/s
Energy fluence (15-150 keV)             : 3.49542e-07 ( -4.6362e-08  4.51718e-08 ) ergs/cm2
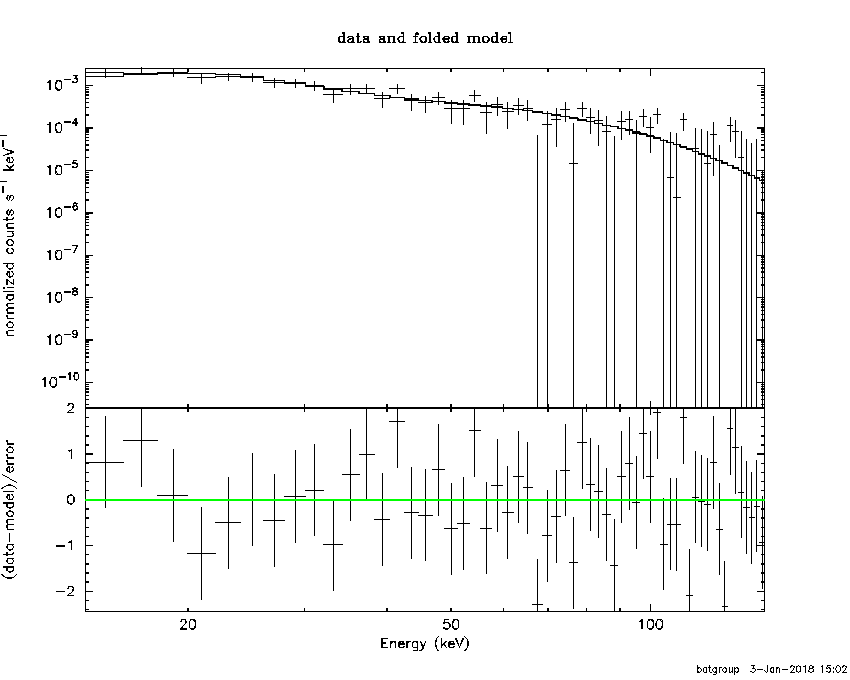
Band function
Time interval is from   -7.624 sec. to    6.300 sec.

Spectral model in the Band function:
------------------------------------------------------------
Parameters  : value       lower 90%   higher 90%
alpha       : -1.91025   ( 1.83948   0.666692 )
beta        : -10.00000    ( 10   2.13163e-14 )
Epeak [keV] : 37.3984      ( -28.0496 -37.3984 )
Norm@50keV   : 3.14545E-03    ( -0.000289468   0.00508527 )
------------------------------------------------------------
#Fit statistic : Chi-Squared =          51.47 using 59 PHA bins.
# Reduced chi-squared =         0.9358 for     55 degrees of freedom
# Null hypothesis probability =   6.103927e-01

Photon flux (15-150 keV)    in 13.92 sec:  (    ) ph/cm2/s
Energy fluence (15-150 keV)             : 0 ( 0  0 ) ergs/cm2
Single BB
Spectral model blackbody:
------------------------------------------------------------
Parameters  : value    Lower 90%  Upper 90%
kT [keV]    : 9.55035  (-1.06766  1.22243)
R^2/D10^2   : 0.223438  (-0.083068   0.130431)
(R is the radius in km and D10 is the distance to the source in units of 10 kpc)
------------------------------------------------------------
#Fit statistic : Chi-Squared =          80.68 using 59 PHA bins.
# Reduced chi-squared =          1.415 for     57 degrees of freedom
# Null hypothesis probability =   2.121891e-02

Energy  Fluence     90% Error
[keV]   [erg/cm2]   [erg/cm2]
15- 25  5.678e-08   9.306e-09
25- 50  1.321e-07   1.485e-08
50-150  6.025e-08   1.671e-08
15-150  2.491e-07   2.909e-08
Thermal bremsstrahlung (OTTB)
Spectral model: thermal bremsstrahlung
------------------------------------------------------------
Parameters  : value         Lower 90%    Upper 90%
kT [keV]    : 66.9436       (-17.8486      28.6158)
Norm        : 2.05646       (-0.306478     0.360488)
------------------------------------------------------------
#Fit statistic : Chi-Squared =          53.33 using 59 PHA bins.
# Reduced chi-squared =         0.9356 for     57 degrees of freedom
# Null hypothesis probability =   6.134899e-01

Energy  Fluence     90% Error
[keV]   [erg/cm2]   [erg/cm2]
15- 25  7.307e-08   8.916e-09
25- 50  1.148e-07   1.169e-08
50-150  1.426e-07   3.523e-08
15-150  3.305e-07   4.273e-08
Double BB
Spectral model: bbodyrad<1> + bbodyrad<2>
------------------------------------------------------------
Parameters  : value         Lower 90%    Upper 90%
kT1 [keV]   : 5.92667        (-1.76652      1.60597)
R1^2/D10^2  : 1.06368        (-0.60804      1.28266)
kT2 [keV]   : 22.2701        (-7.20032      15.1309)
R2^2/D10^2  : 6.25358E-03    (-0.00521624   0.0239577)
------------------------------------------------------------
#Fit statistic : Chi-Squared =          53.70 using 59 PHA bins.
# Reduced chi-squared =         0.9763 for     55 degrees of freedom
# Null hypothesis probability =   5.245358e-01

Energy  Fluence     90% Error
[keV]   [erg/cm2]   [erg/cm2]
15- 25  7.583e-08   2.973e-08
25- 50  1.082e-07   3.341e-08
50-150  1.626e-07   8.896e-08
15-150  3.466e-07   1.342e-07
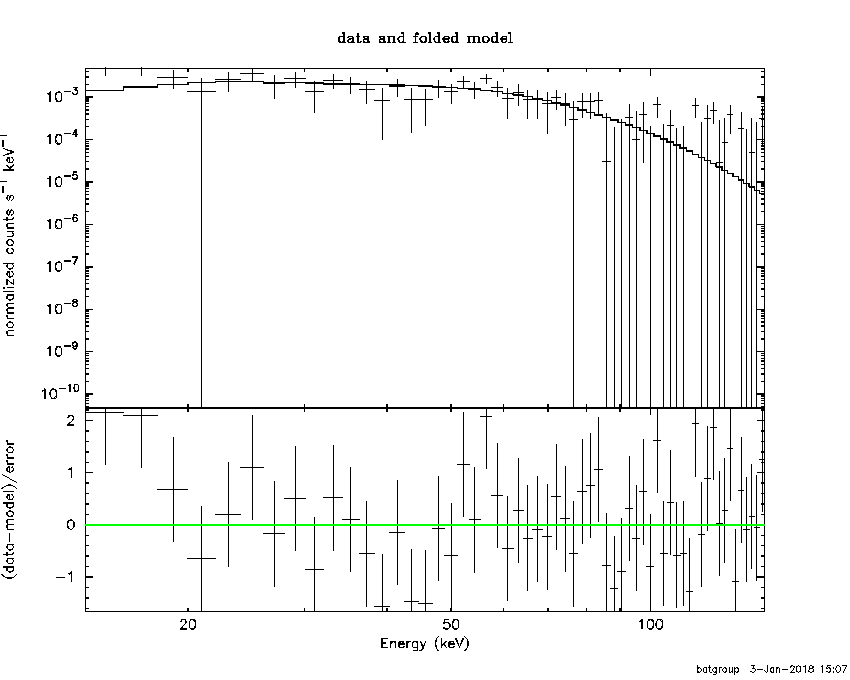
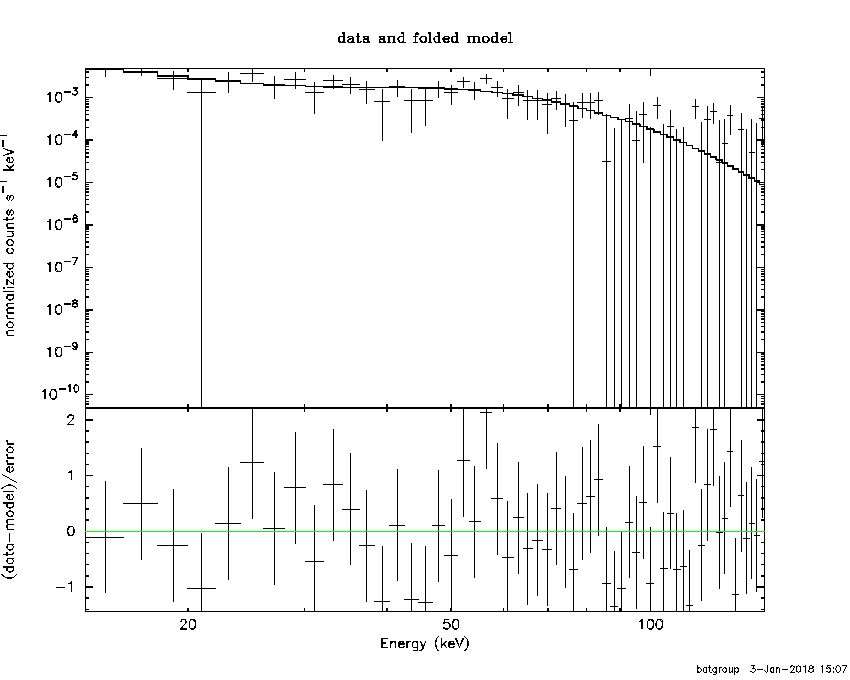
Peak spectrum fit
Power-law model

Time interval is from    0.800 sec. to    1.800 sec.

Spectral model in power-law:
------------------------------------------------------------
Parameters  : value       lower 90%   higher 90%
Photon index: 1.47268     ( -0.239999   0.246964 )
Norm@50keV  : 8.03179E-03    ( -0.00118495   0.00117121 )
------------------------------------------------------------
#Fit statistic : Chi-Squared =          48.09 using 59 PHA bins.
# Reduced chi-squared =         0.8437 for     57 degrees of freedom
# Null hypothesis probability =   7.936034e-01

Photon flux (15-150 keV)    in 1 sec: 0.995497 ( -0.1404  0.140499 ) ph/cm2/s
Energy fluence (15-150 keV)             : 7.65449e-08 ( -1.24423e-08  1.26448e-08 ) ergs/cm2
Cutoff power-law model

Time interval is from    0.800 sec. to    1.800 sec.
Spectral model in the cutoff power-law:
------------------------------------------------------------
Parameters  : value       lower 90%   higher 90%
Photon index: 0.724365     ( -1.35878   0.910265 )
Epeak [keV] : 86.1981      ( -29.8221 -86.1795 )
Norm@50keV  : 1.90355E-02    ( -0.0118127   0.0662458 )
------------------------------------------------------------
#Fit statistic : Chi-Squared =          46.68 using 59 PHA bins.
# Reduced chi-squared =         0.8335 for     56 degrees of freedom
# Null hypothesis probability =   8.081685e-01

Photon flux (15-150 keV)    in 1 sec: 0.965717 ( -0.14886  0.147283 ) ph/cm2/s
Energy fluence (15-150 keV)             : 7.29165e-08 ( -1.32865e-08  1.36943e-08 ) ergs/cm2
Band function

Time interval is from    0.800 sec. to    1.800 sec.

Spectral model in the Band function:
------------------------------------------------------------
Parameters  : value       lower 90%   higher 90%
alpha       : -0.805832   ( 0.804841   1.55547 )
beta        : -2.16440    ( 2.35142   3.96366 )
Epeak [keV] : 89.9603      ( -90.0871 -90.0871 )
Norm@50keV   : 1.73793E-02    ( -0.0101846   0 )
------------------------------------------------------------
#Fit statistic : Chi-Squared =          46.69 using 59 PHA bins.
# Reduced chi-squared =         0.8488 for     55 degrees of freedom
# Null hypothesis probability =   7.799928e-01

Photon flux (15-150 keV)    in 1 sec: 0.965132 (    ) ph/cm2/s
Energy fluence (15-150 keV)             : 0 ( 0  0 ) ergs/cm2
Single BB
Spectral model blackbody:
------------------------------------------------------------
Parameters  : value    Lower 90%  Upper 90%
kT [keV]    : 15.6867  (-2.29767  2.7503)
R^2/D10^2   : 0.100649  (-0.0432672   0.0732522)
(R is the radius in km and D10 is the distance to the source in units of 10 kpc)
------------------------------------------------------------
#Fit statistic : Chi-Squared =          52.18 using 59 PHA bins.
# Reduced chi-squared =         0.9155 for     57 degrees of freedom
# Null hypothesis probability =   6.560835e-01

Energy  Fluence     90% Error
[keV]   [erg/cm2]   [erg/cm2]
15- 25  5.143e-09   1.449e-09
25- 50  2.127e-08   4.715e-09
50-150  3.631e-08   1.006e-08
15-150  6.272e-08   1.244e-08
Thermal bremsstrahlung (OTTB)
Spectral model: thermal bremsstrahlung
------------------------------------------------------------
Parameters  : value         Lower 90%    Upper 90%
kT [keV]    : 199.363       (-83.3021      -199.363)
Norm        : 4.08570       (-0.570095     0.570762)
------------------------------------------------------------
#Fit statistic : Chi-Squared =          47.56 using 59 PHA bins.
# Reduced chi-squared =         0.8344 for     57 degrees of freedom
# Null hypothesis probability =   8.091392e-01

Energy  Fluence     90% Error
[keV]   [erg/cm2]   [erg/cm2]
15- 25  1.017e-08   5.775e-09
25- 50  1.957e-08   1.092e-08
50-150  4.292e-08   2.386e-08
15-150  7.267e-08   4.031e-08
Double BB
Spectral model: bbodyrad<1> + bbodyrad<2>
------------------------------------------------------------
Parameters  : value         Lower 90%    Upper 90%
kT1 [keV]   : 2.25667        (-1.30569      2.77461)
R1^2/D10^2  : 189.086        (-200.054      1.42009e+06)
kT2 [keV]   : 17.4136        (-2.79481      4.03023)
R2^2/D10^2  : 6.66809E-02    (-0.0357837   0.063048)
------------------------------------------------------------
#Fit statistic : Chi-Squared =          42.33 using 59 PHA bins.
# Reduced chi-squared =         0.7697 for     55 degrees of freedom
# Null hypothesis probability =   8.944073e-01

Energy  Fluence     90% Error
[keV]   [erg/cm2]   [erg/cm2]
15- 25  8.856e-09   3.506e-09
25- 50  1.867e-08   5.165e-09
50-150  4.022e-08   1.367e-08
15-150  6.775e-08   1.605e-08
Plot creation:
Wed Jan  3 15:13:56 EST 2018