batgrbproduct analysis for trigger=736432
batgrbproduct Analysis for Trigger=736432
Analysis Summary
Notes:
- 1) No attempt has been made to eliminate the non-significant decimal places.
- 2) This batgrbproduct analysis is done of the amount of data for this trigger downloaded to date.
- 3) This batgrbproduct analysis is using the flight position for the mask-weighting calculation.
- 4) This page will be updated for up to 15 downlinks after the trigger.
======================================================================
                  BAT GRB EVENT DATA PROCESSING REPORT
    Process Script Ver: batgrbproduct v2.46
    Process Start Time (local time): Sat Feb  4 08:53:22 EST 2017
             Host Name: bat1
   Current Working Dir: /local/data/bat1/prebascript/trigger736432/GCN5_download_cron
======================================================================

  Trigger: 00736432      Segment: 000

  BAT Trigger Time: 507773039.616   [s; MET]
      Trigger Stop: 507773043.712   [s; MET]
               UTC: 2017-02-03T00:03:41.060220    [includes UTCF correction]
       Where From?: TDRSS position message

  BAT
    RA: 332.860488803399   Dec: 25.1734109087689  [deg; J2000]

     Catalogged Source?: NO
     Point Source?:      YES
     GRB Indicated?:     YES    [ by BAT flight software ]
     Image S/N Ratio:    7.81
     Image Trigger?:     NO
     Rate S/N Ratio:     11.4891252930761  [ if not an image trigger ]
     Image S/N Ratio:    7.81

  Flight Position:   [ source = BAT ]
    RA: 332.860488803399   Dec: 25.1734109087689  [deg; J2000]

  Ground Position:   [ source = BAT pre-slew burst ]
    RA: 332.860873048044   Dec: 25.1856768918587  [deg; J2000]
        { 22h 11m 26.6s , +25d 11' 08.4" }
         +/- 2.22235749559914 [arcmin] (estimated 90% radius based on SNR)
         +/- 1.02929549488502 [arcmin] (formal 1-sigma fit error)
    SNR: 9.72008179715165

  Angular difference between Flight and Ground position is 0.736255 arcmin

  Partial Coding Fraction: 0.671875    [ including projection effects ]

  Duration
     T90: 45.1679999828339 +/- 6.43331458309202
        Measured from: 0.728000104427338
                   to: 45.8960000872612     [s; relative to TRIGTIME]
     T50: 22.4839999675751 +/- 13.354025606316
        Measured from: 3.81200009584427
                   to: 26.2960000634193     [s; relative to TRIGTIME]


  Fluence
     Peak Flux  (peak 1 second)
        Measured from: 3.7039999961853
                   to: 4.7039999961853     [s; relative to TRIGTIME]
     Total Fluence
        Measured from: -0.0400000214576721
                   to: 48.4319999814034     [s; relative to TRIGTIME]

             Band 1     Band 2     Band 3     Band 4
              15-25      25-50     50-100    100-350     keV
 Total     0.296486   0.338049   0.247799   0.073961
           0.048775   0.050906   0.044376   0.038928 [error]
 Peak      0.023237   0.040570   0.025992   0.004206
           0.007326   0.007791   0.006878   0.005710 [error]

     [ fluence units of on-axis counts / fully illuminated detector ]

======================================================================

=== Fluence/Peak Flux Summary ===

              Model    Band1    Band2    Band3    Band4    Band5    Total
                       15-25    25-50   50-100  100-350   15-150   15-350   keV
Fluence   Power-law 8.67e-08 1.56e-07 2.16e-07 6.21e-07 6.22e-07 1.08e-06   erg/cm2
              Error 2.34e-08 2.49e-08 4.45e-08 2.85e-07 1.06e-07 3.16e-07   erg/cm2
Peak flux Power-law 3.27e-01 2.71e-01 1.53e-01 1.27e-01 8.07e-01 8.78e-01   ph/cm2/s
              Error 1.11e-01 6.44e-02 5.36e-02 8.54e-02 1.92e-01 2.11e-01   ph/cm2/s

Fluence   Cutoff-PL 8.59e-08 1.56e-07 2.16e-07 6.26e-07 6.22e-07 1.09e-06   erg/cm2
              Error 2.32e-08 2.44e-08 4.42e-08 3.24e-07 1.04e-07 3.59e-07   erg/cm2
Peak flux Cutoff-PL 2.93e-01 3.10e-01 1.54e-01 3.57e-02 7.84e-01 7.92e-01   ph/cm2/s
              Error 1.24e-01 9.26e-02 7.21e-02 1.30e-01 1.95e-01 2.03e-01   ph/cm2/s

Fluence        Band -------- -------- -------- -------- -------- --------   erg/cm2
              Error -------- -------- -------- -------- -------- --------   erg/cm2
Peak flux      Band 2.99e-01 3.01e-01 1.58e-01 5.09e-02 7.94e-01 8.10e-01   ph/cm2/s
              Error -------- -------- -------- -------- -------- --------   ph/cm2/s
=== Time-averaged spectral analysis ===

Model Ph_index Ph_90err Epeak  Epeak_90err Norm     Nomr_90err chi2   dof
PL    1.533    0.285    -      -           1.36e-03 2.11e-04   51.990 57
CPL   1.541    0.381    9999.3    0.0      1.36e-03 7.46e-04   52.010 56


=== 1-s peak spectral analysis ===

Model Ph_index Ph_90err Epeak  Epeak_90err Norm     Nomr_90err chi2   dof
PL    1.829    0.409    -      -           5.79e-03 1.59e-03   55.460 57
CPL   0.712    2.377      49.5    0.0      2.50e-02 0.00e+00   54.200 56

Model      : spectral model: simple power-law (PL) and cutoff power-law (CPL)
Ph_index   : photon index: E^-{Ph_index} (minus sign is not included in the index)
Ph_90err   : 90% error of the photon index
Epeak      : Epeak in keV
Epeak_90err: 90% error of Epeak
Norm       : normalization at 50 keV in PL model and at 1 keV in CPL model
Nomr_90err : 90% error of the normalization
chi2       : Chi-Squared
dof        : degree of freedom
=== T90/T50 calculation in the 50-300 keV band (BATSE band) using 64 ms lc ===

T90 in the 50-300 keV band: 6.848000 sec.
T50 in the 50-300 keV band: 3.904000 sec.
=== Table of the duration information ==

        Value   tstart    tstop
T100   48.472   -0.040   48.432
T90    45.168    0.728   45.896
T50    22.484    3.812   26.296
Peak    1.000    3.704    4.704
Image
Pre-slew 15-350 keV image (Event data; bkg subtracted)
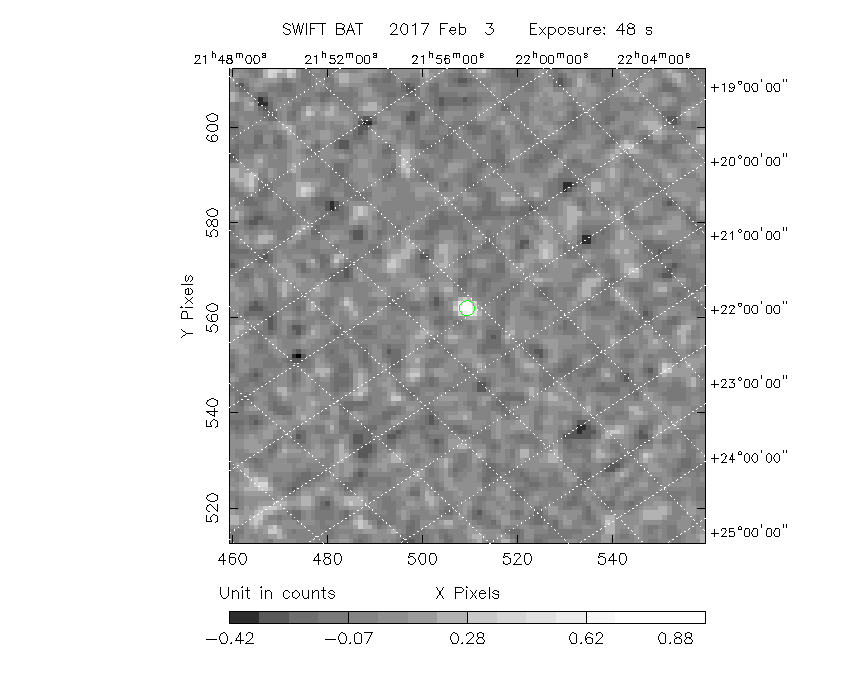
#   RAcent  DECcent POSerr  Theta    Phi     Peak Cts     SNR  Name
  332.8609 +25.1857 0.0197   38.6  -13.0       1.0618     9.7  TRIG_00736432
------------------------------------------

Foreground time interval of the image:
 -0.040  48.432 (delta_t =  48.472 [sec])
Background time interval of the image:
-129.715  -0.040 (delta_t = 129.675 [sec])
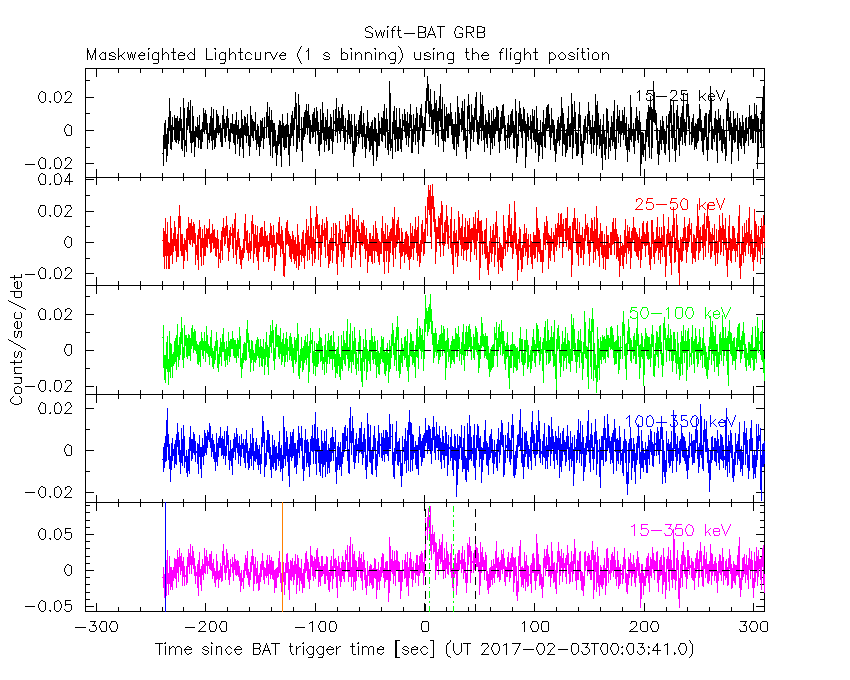
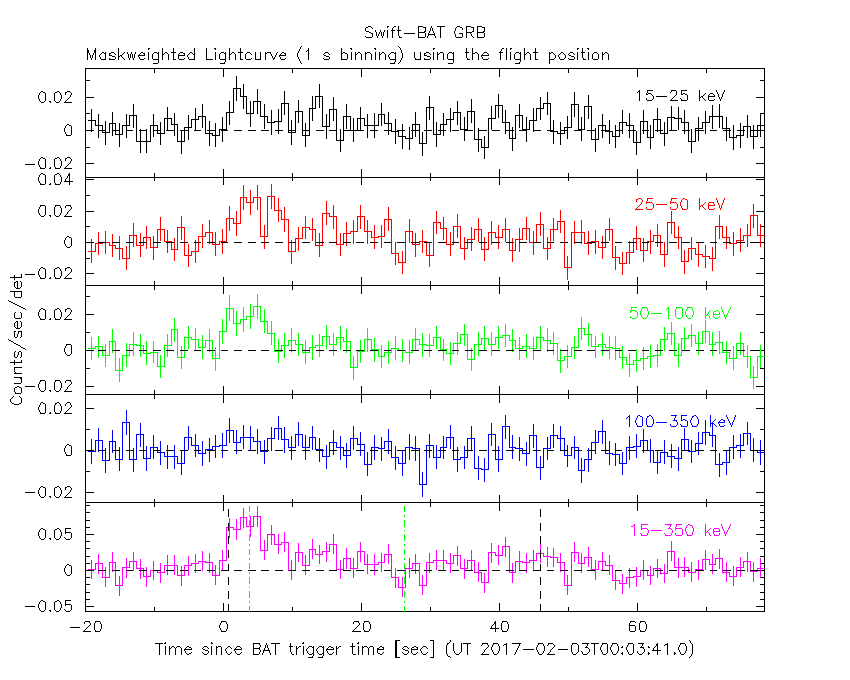
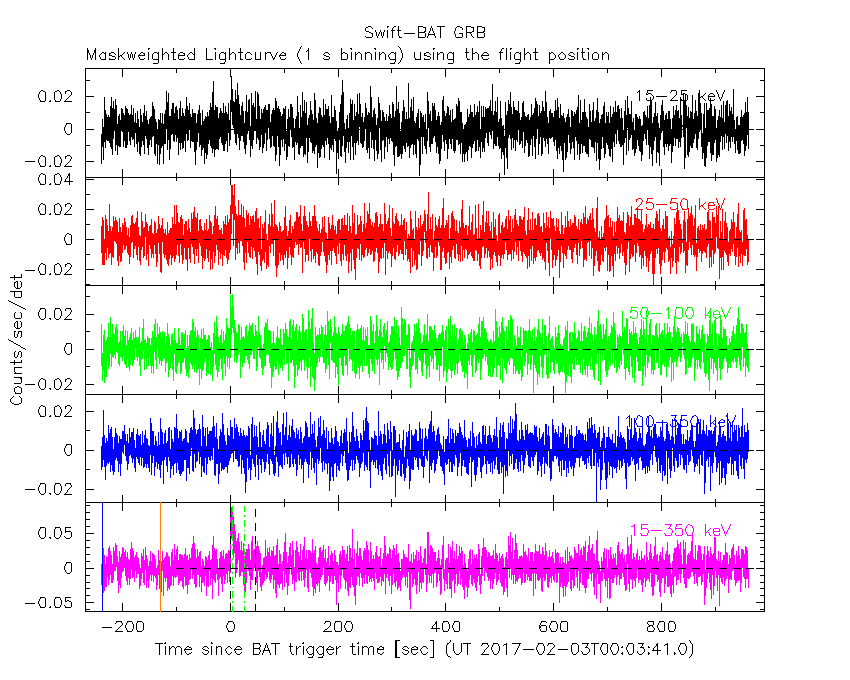
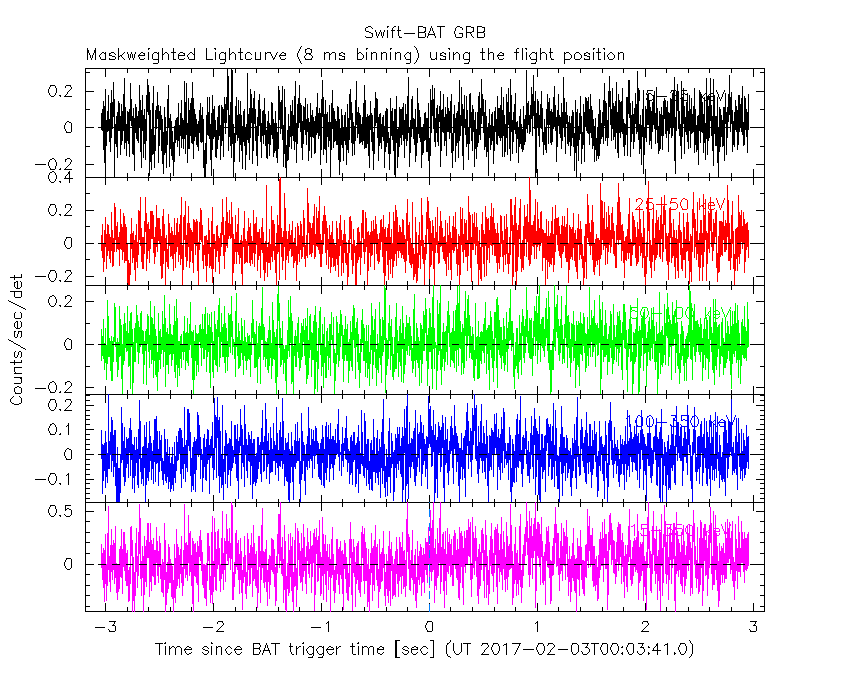
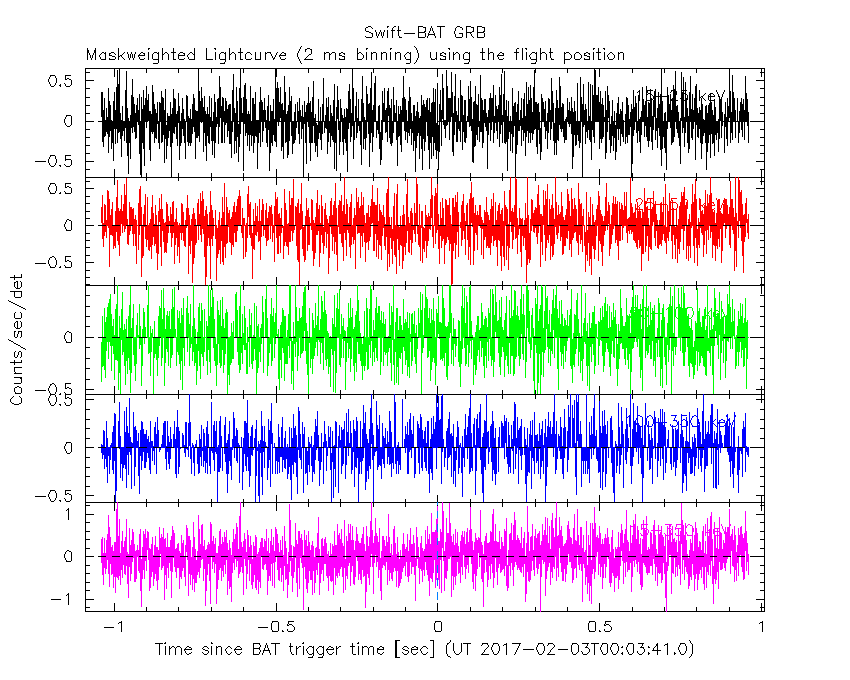
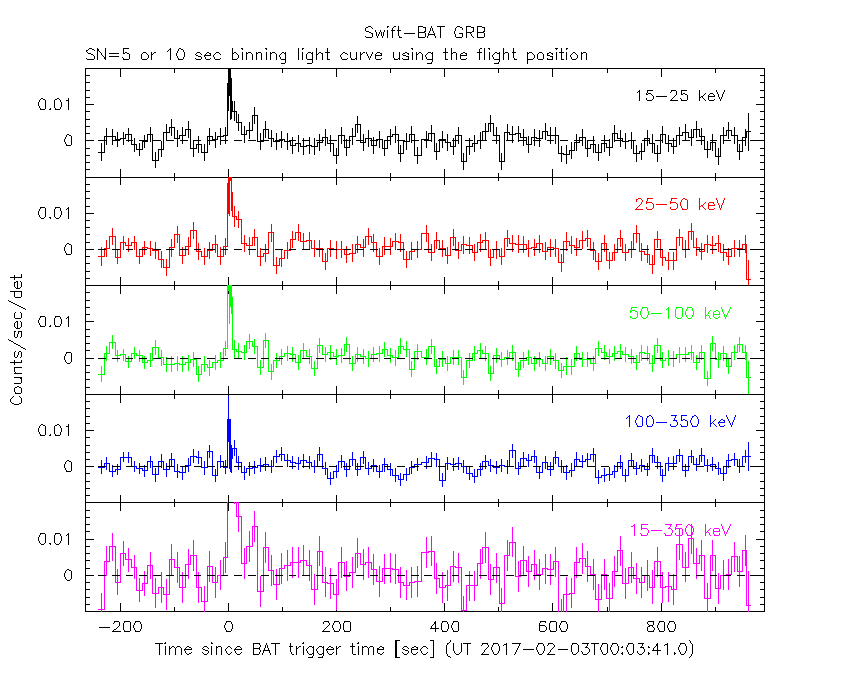
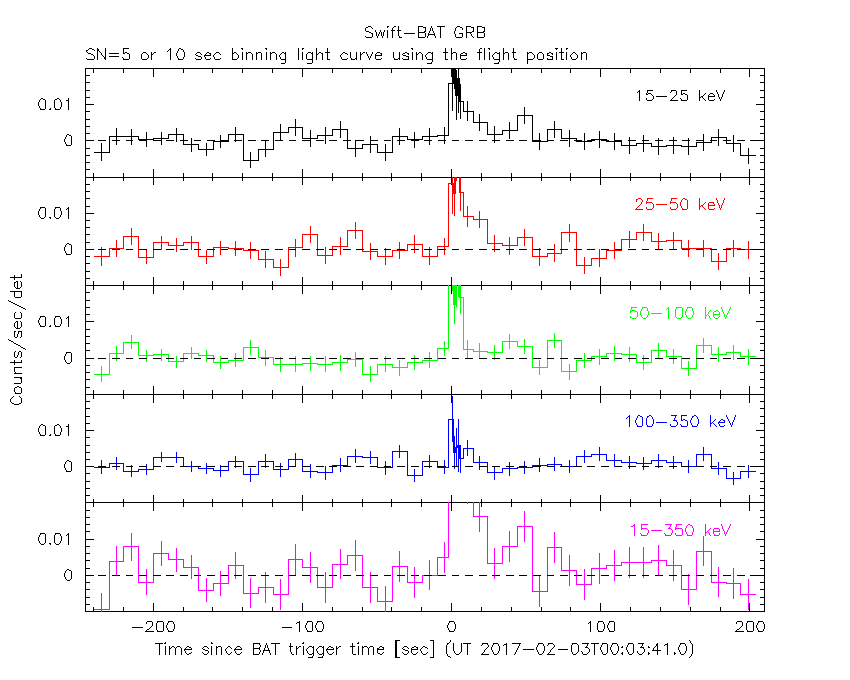
Lightcurves
Notes:
- 1) All plots contain as much data as has been downloaded to date.
- 2) The mask-weighted light curves are using the flight position.
- 3) Multiple plots of different time binning/intervals are shown to cover all scenarios of short/long GRBs, rate/image triggers, and real/false positives.
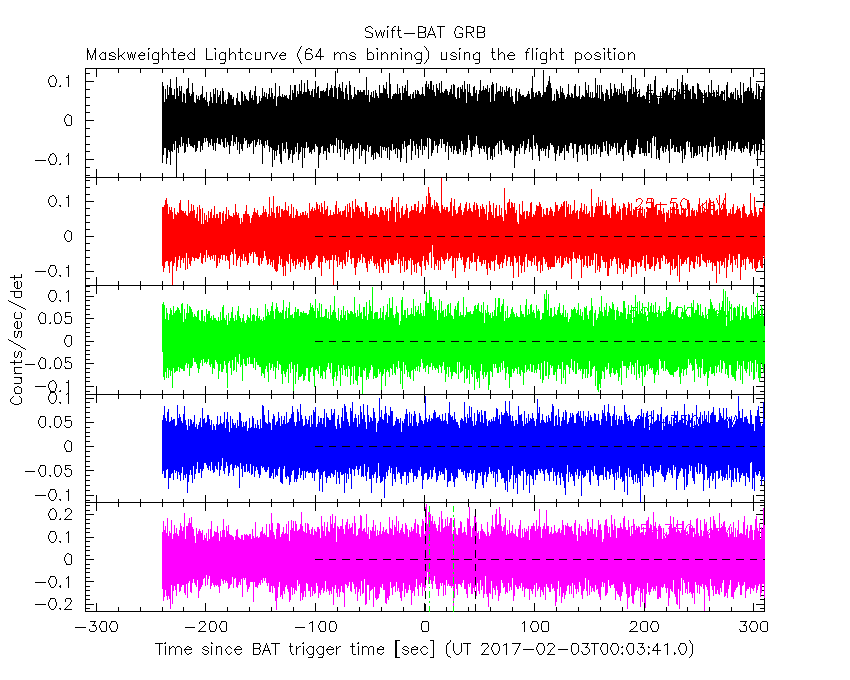
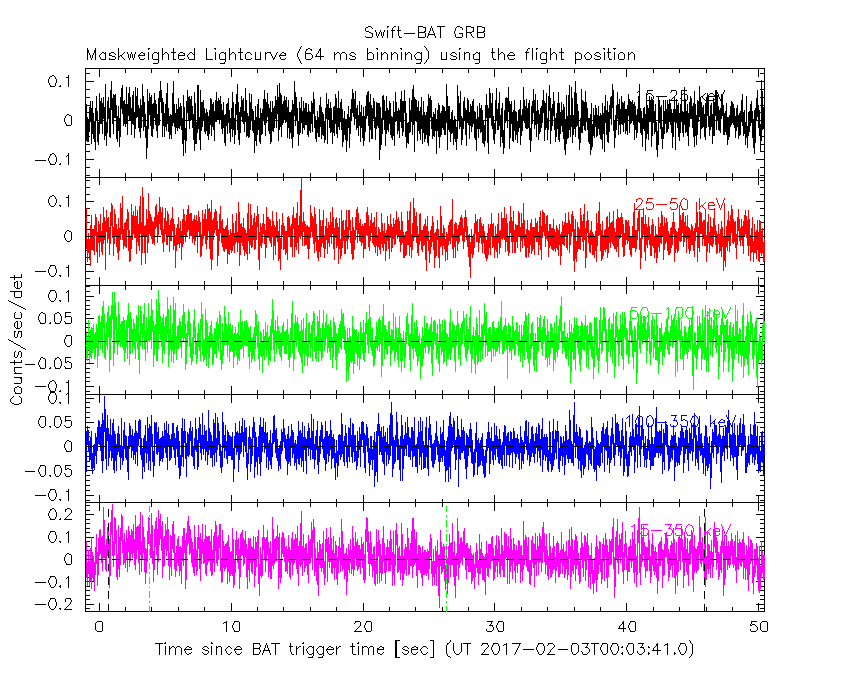
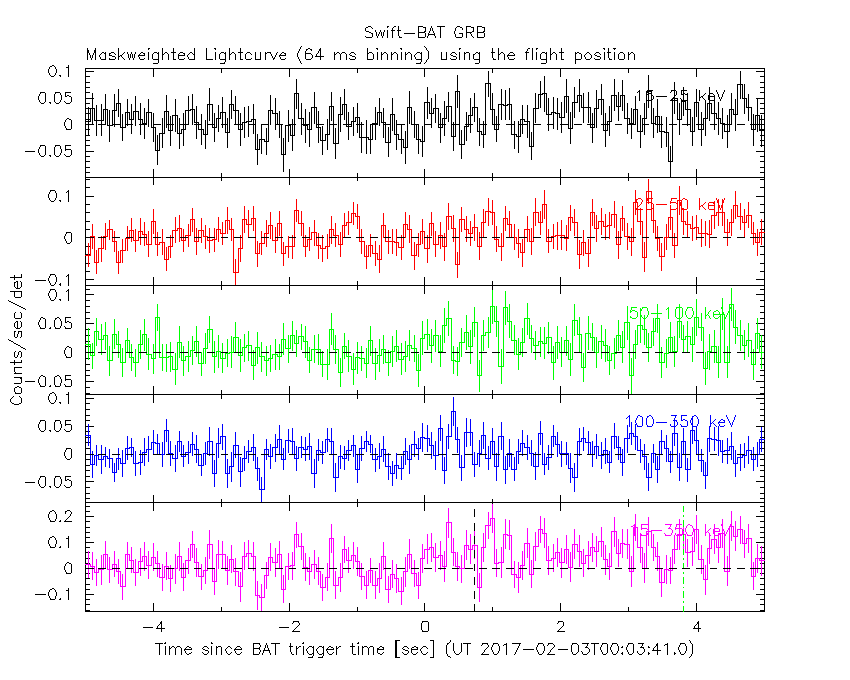
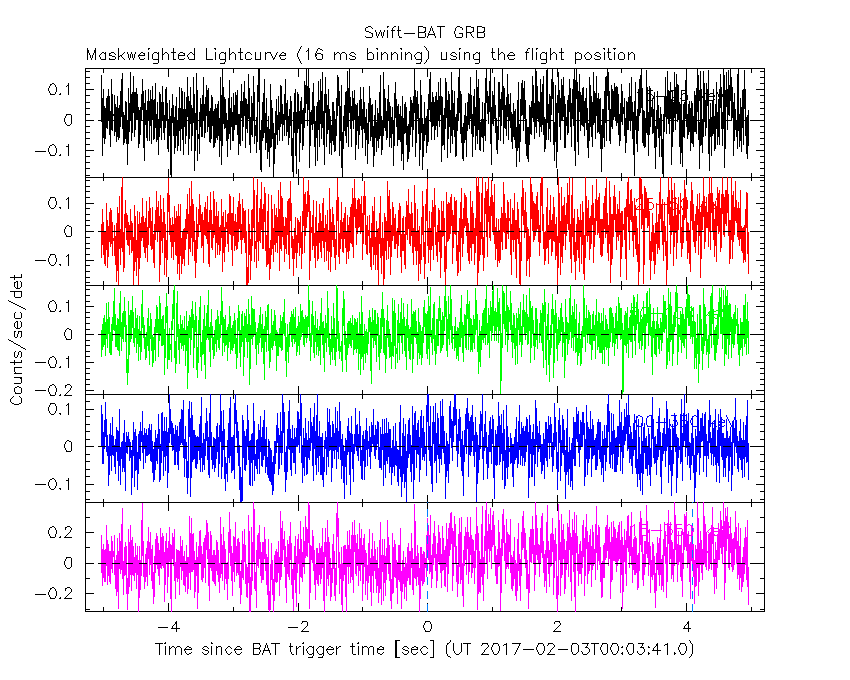
- 4) For all the mask-weighted lightcurves, the y-axis units are counts/sec/det where a det is 0.4 x 0.4 = 0.16 sq cm.
- 5) The verticle lines correspond to following: green dotted lines are T50 interval, black dotted lines are T90 interval, blue solid line(s) is a spacecraft slew start time, and orange solid line(s) is a spacecraft slew end time.
- 6) Time of each bin is in the middle of the bin.
1 s binning
From T0-310 s to T0+310 s
From T100_start - 20 s to T100_end + 30 s
Full time interval
64 ms binning
Full time interval
From T100_start to T100_end
From T0-5 sec to T0+5 sec
16 ms binning
From T100_start-5 s to T100_start+5 s
8 ms binning
From T100_start-3 s to T100_start+3 s
2 ms binning
From T100_start-1 s to T100_start+1 s
SN=5 or 10 sec. binning (whichever binning is satisfied first)
SN=5 or 10 sec. binning (T < 200 sec)
Spectra
Notes:
- 1) The fitting includes the systematic errors.
- 2) For long bursts, a spectral fit of the pre-slew DRM will introduce some errors in both a spectral shape and a normalization if the PHA file contains a lot of the slew/post-slew time interval.
- 3) For fits to more complicated models (e.g. a power-law over a cutoff power-law), the BAT team has decided to require a chi-square improvement of more than 6 for each extra dof.
- 4) For short bursts (T90<1sec), the specrtum is also fit with Blackbody, OTTB, and Double Blackbody.
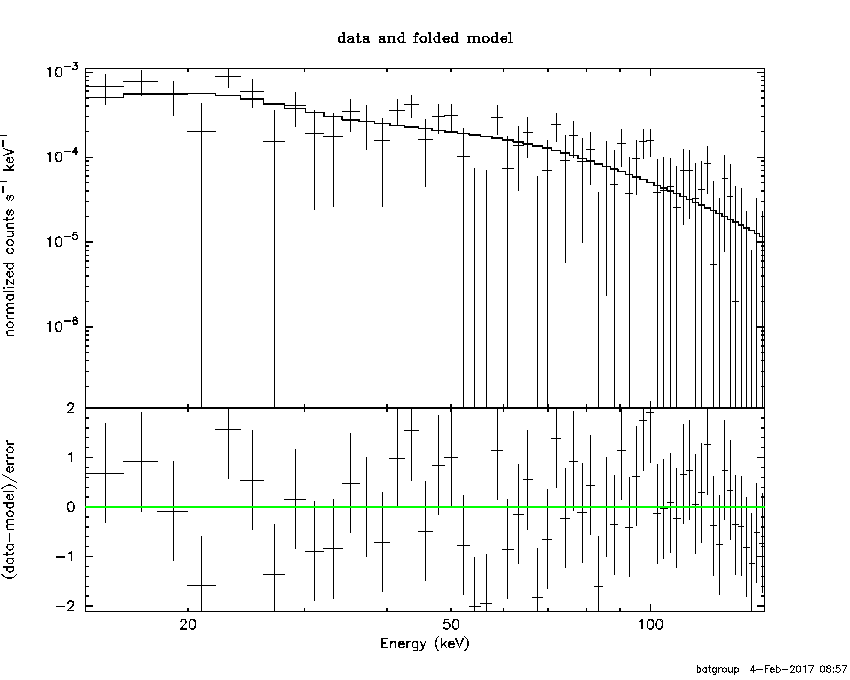
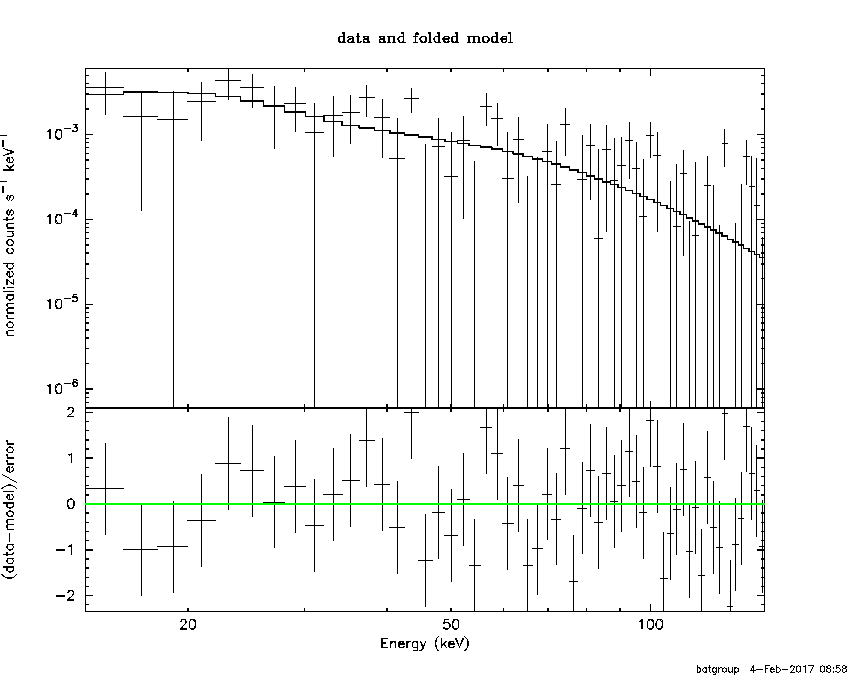
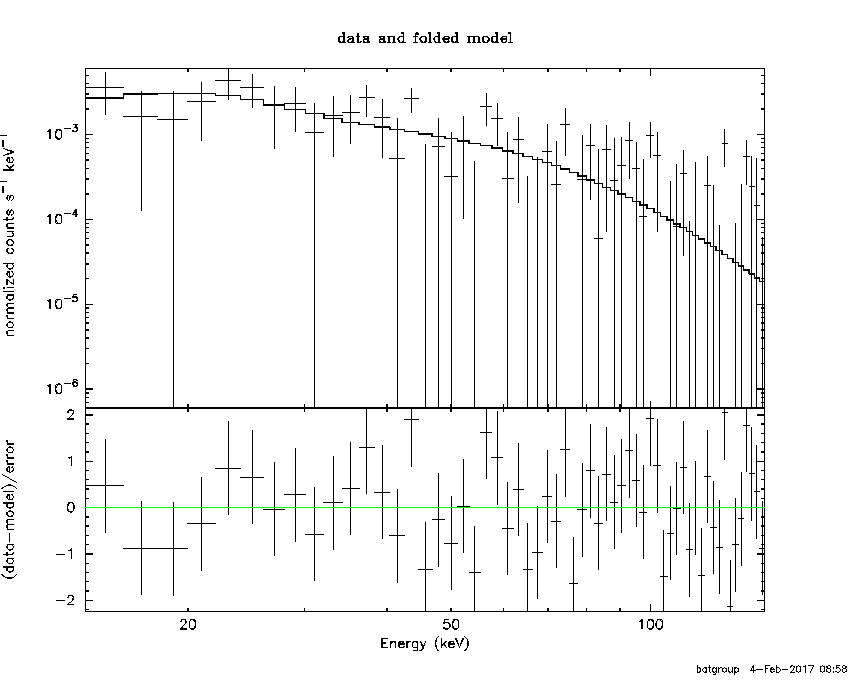
Time averaged spectrum fit using the pre-slew DRM
Power-law model

Time interval is from   -0.040 sec. to   48.432 sec.

Spectral model in power-law:
------------------------------------------------------------
Parameters  : value       lower 90%   higher 90%
Photon index: 1.53264     ( -0.282297   0.288026 )
Norm@50keV  : 1.35906E-03    ( -0.000212049   0.000209424 )
------------------------------------------------------------
#Fit statistic : Chi-Squared =          51.99 using 59 PHA bins.
# Reduced chi-squared =         0.9122 for     57 degrees of freedom
# Null hypothesis probability =   6.628616e-01

Photon flux (15-150 keV)    in 48.47 sec: 0.171197 ( -0.0265363  0.0266559 ) ph/cm2/s
Energy fluence (15-150 keV)             : 6.2172e-07 ( -1.05205e-07  1.06317e-07 ) ergs/cm2
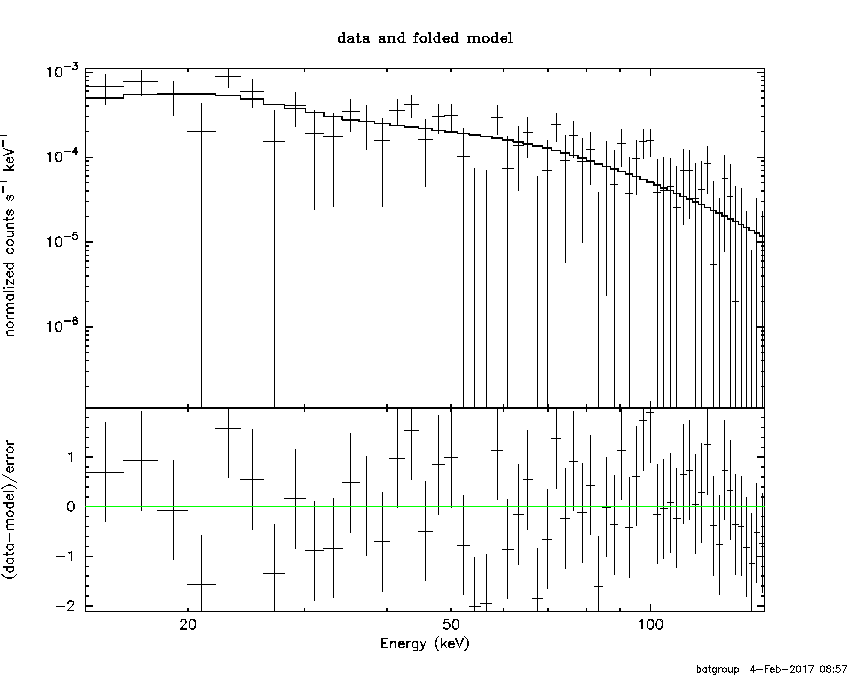
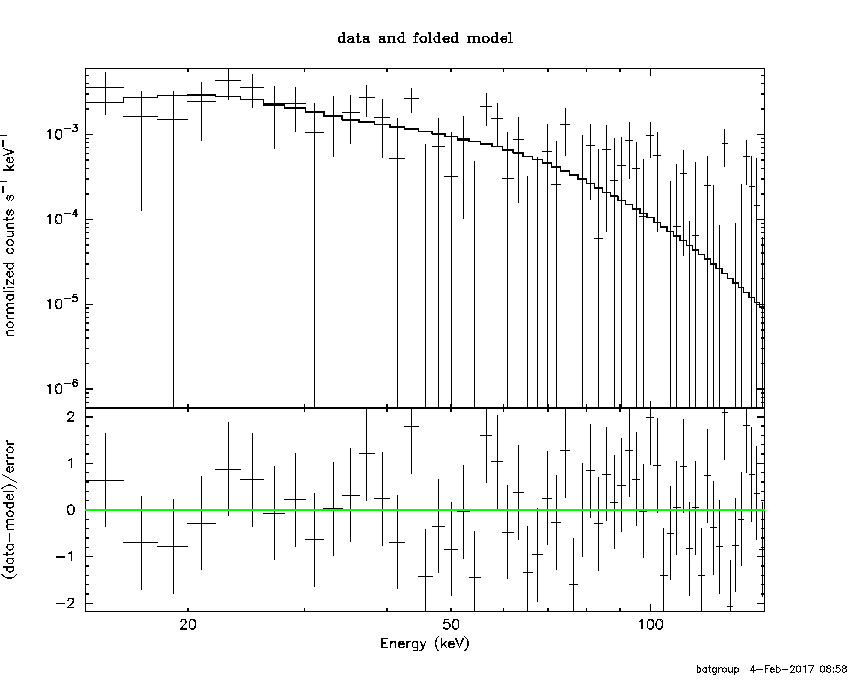
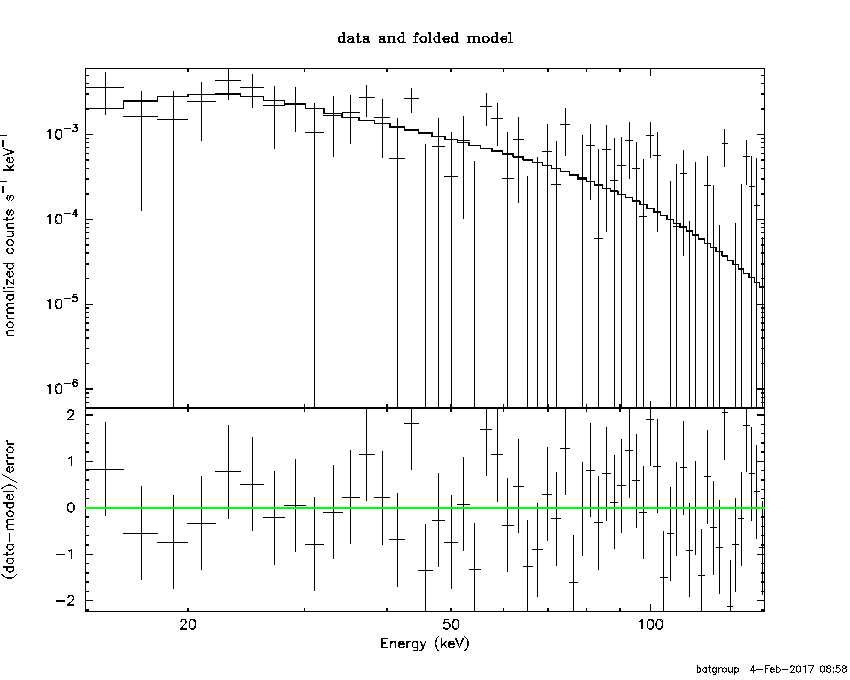
Cutoff power-law model
Time interval is from   -0.040 sec. to   48.432 sec.
Spectral model in the cutoff power-law:
------------------------------------------------------------
Parameters  : value       lower 90%   higher 90%
Photon index: 1.54109     ( -0.481887   0.279888 )
Epeak [keV] : 9999.31      ( -9999.36 -9999.36 )
Norm@50keV  : 1.35517E-03    ( -0.000210438   0.00128188 )
------------------------------------------------------------
#Fit statistic : Chi-Squared =          52.01 using 59 PHA bins.
# Reduced chi-squared =         0.9287 for     56 degrees of freedom
# Null hypothesis probability =   6.266915e-01

Photon flux (15-150 keV)    in 48.47 sec: 0.171822 ( -0.027398  0.02606 ) ph/cm2/s
Energy fluence (15-150 keV)             : 6.21686e-07 ( -1.04938e-07  1.0375e-07 ) ergs/cm2
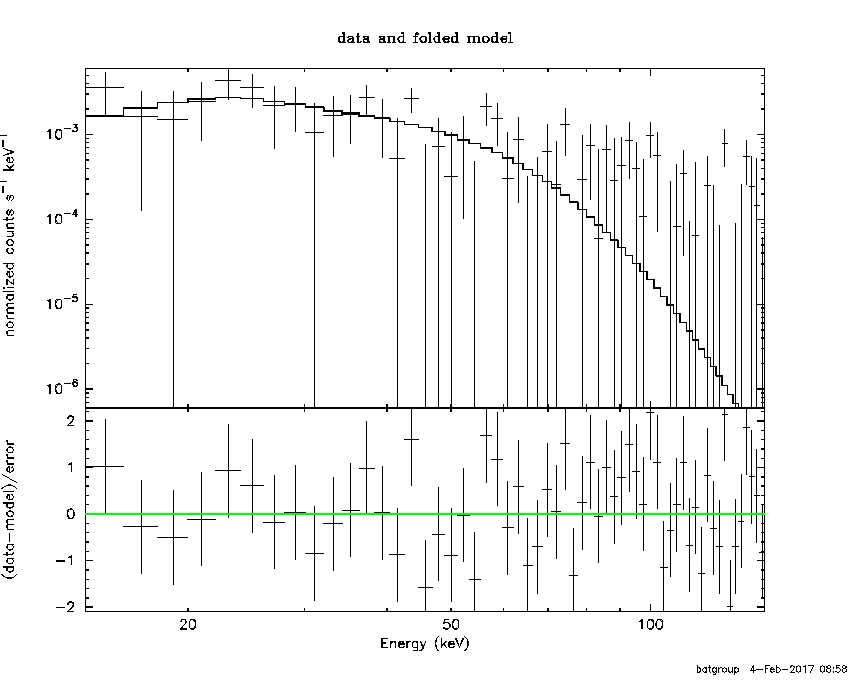
Band function
Time interval is from   -0.040 sec. to   48.432 sec.

Spectral model in the Band function:
------------------------------------------------------------
Parameters  : value       lower 90%   higher 90%
alpha       : -1.28294   ( 1.28294   1.28294 )
beta        : -1.53261    ( 1.53261   0.282252 )
Epeak [keV] : 18.1400      ( -18.14 -18.14 )
Norm@50keV   : 2.92421E-03    ( -0.00176911   0.210255 )
------------------------------------------------------------
#Fit statistic : Chi-Squared =          51.99 using 59 PHA bins.
# Reduced chi-squared =         0.9454 for     55 degrees of freedom
# Null hypothesis probability =   5.901803e-01

Photon flux (15-150 keV)    in 48.47 sec:  (    ) ph/cm2/s
Energy fluence (15-150 keV)             : 0 ( 0  0 ) ergs/cm2
Single BB
Spectral model blackbody:
------------------------------------------------------------
Parameters  : value    Lower 90%  Upper 90%
kT [keV]    : 15.6428  (-3.70494  5.26245)
R^2/D10^2   : 1.58451E-02  (-0.0155954   0.0250604)
(R is the radius in km and D10 is the distance to the source in units of 10 kpc)
------------------------------------------------------------
#Fit statistic : Chi-Squared =          72.05 using 59 PHA bins.
# Reduced chi-squared =          1.264 for     57 degrees of freedom
# Null hypothesis probability =   8.648098e-02

Energy  Fluence     90% Error
[keV]   [erg/cm2]   [erg/cm2]
15- 25  3.904e-08   1.307e-08
25- 50  1.611e-07   4.748e-08
50-150  2.731e-07   8.560e-08
15-150  4.733e-07   1.158e-07
Thermal bremsstrahlung (OTTB)
Spectral model: thermal bremsstrahlung
------------------------------------------------------------
Parameters  : value         Lower 90%    Upper 90%
kT [keV]    : 199.363       (-89.2153      -199.363)
Norm        : 0.695394       (-0.10476     0.10494)
------------------------------------------------------------
#Fit statistic : Chi-Squared =          53.30 using 59 PHA bins.
# Reduced chi-squared =         0.9350 for     57 degrees of freedom
# Null hypothesis probability =   6.147837e-01

Energy  Fluence     90% Error
[keV]   [erg/cm2]   [erg/cm2]
15- 25  8.393e-08   4.823e-08
25- 50  1.615e-07   9.112e-08
50-150  3.541e-07   1.985e-07
15-150  5.995e-07   3.361e-07
Double BB
Spectral model: bbodyrad<1> + bbodyrad<2>
------------------------------------------------------------
Parameters  : value         Lower 90%    Upper 90%
kT1 [keV]   : 6.42596        (-2.87836      2.91371)
R1^2/D10^2  : 0.279032        (-0.206447      3.23851)
kT2 [keV]   : 33.3894        (-11.9646      37.3661)
R2^2/D10^2  : 1.06062E-03    (-0.00091283   0.00368193)
------------------------------------------------------------
#Fit statistic : Chi-Squared =          51.86 using 59 PHA bins.
# Reduced chi-squared =         0.9429 for     55 degrees of freedom
# Null hypothesis probability =   5.952962e-01

Energy  Fluence     90% Error
[keV]   [erg/cm2]   [erg/cm2]
15- 25  8.974e-08   5.264e-08
25- 50  1.477e-07   7.774e-08
50-150  4.149e-07   2.368e-07
15-150  6.523e-07   3.275e-07
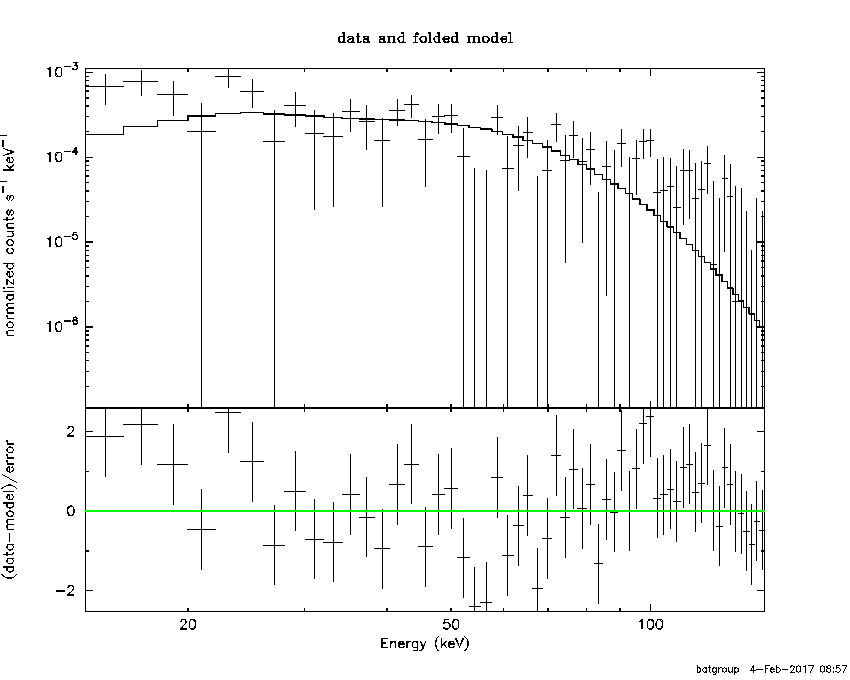
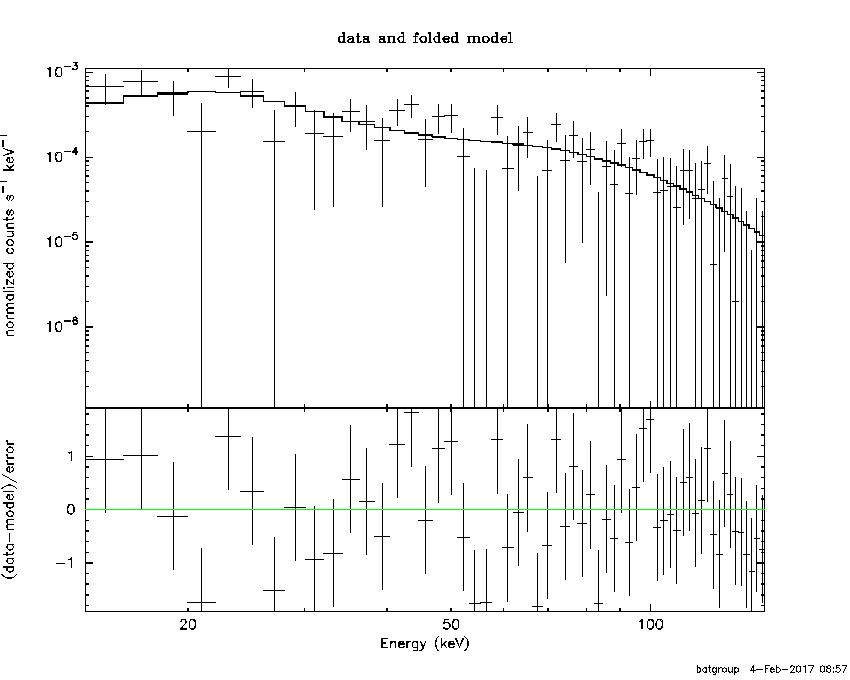
Peak spectrum fit
Power-law model
Time interval is from    3.704 sec. to    4.704 sec.

Spectral model in power-law:
------------------------------------------------------------
Parameters  : value       lower 90%   higher 90%
Photon index: 1.82861     ( -0.38981   0.428985 )
Norm@50keV  : 5.79213E-03    ( -0.00162114   0.00156372 )
------------------------------------------------------------
#Fit statistic : Chi-Squared =          55.46 using 59 PHA bins.
# Reduced chi-squared =         0.9729 for     57 degrees of freedom
# Null hypothesis probability =   5.331553e-01

Photon flux (15-150 keV)    in 1 sec: 0.807164 ( -0.191726  0.191832 ) ph/cm2/s
Energy fluence (15-150 keV)             : 5.32792e-08 ( -1.45449e-08  1.50466e-08 ) ergs/cm2
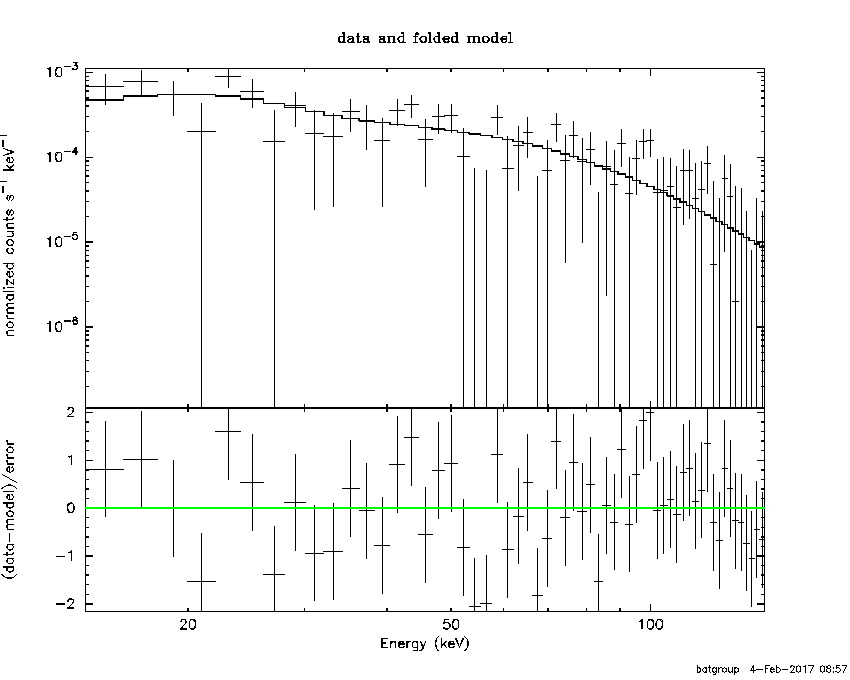
Cutoff power-law model
Time interval is from    3.704 sec. to    4.704 sec.
Spectral model in the cutoff power-law:
------------------------------------------------------------
Parameters  : value       lower 90%   higher 90%
Photon index: 0.712181     ( -3.29477   1.4596 )
Epeak [keV] : 49.4871      (   )
Norm@50keV  : 2.50445E-02    (     )
------------------------------------------------------------
#Fit statistic : Chi-Squared =          54.20 using 59 PHA bins.
# Reduced chi-squared =         0.9679 for     56 degrees of freedom
# Null hypothesis probability =   5.432569e-01

Photon flux (15-150 keV)    in 1 sec: 0.784461 ( -0.19499  0.195022 ) ph/cm2/s
Energy fluence (15-150 keV)             : 4.8673e-08 ( -1.54806e-08  1.66558e-08 ) ergs/cm2
Band function

Time interval is from    3.704 sec. to    4.704 sec.

Spectral model in the Band function:
------------------------------------------------------------
Parameters  : value       lower 90%   higher 90%
alpha       : -0.712300   ( -4.32457   2.08181 )
beta        : -10.0000    ( 10   1.77636e-15 )
Epeak [keV] : 49.4790      ( -18.2628 527.036 )
Norm@50keV   : 2.50405E-02    ( -0.0250405   2.64258 )
------------------------------------------------------------
#Fit statistic : Chi-Squared =          54.20 using 59 PHA bins.
# Reduced chi-squared =         0.9855 for     55 degrees of freedom
# Null hypothesis probability =   5.051371e-01

Photon flux (15-150 keV)    in 1 sec: 0.794150 (    ) ph/cm2/s
Energy fluence (15-150 keV)             : 4.97355e-08 ( -4.97285e-08  -1.49999e-08 ) ergs/cm2
Single BB
Spectral model blackbody:
------------------------------------------------------------
Parameters  : value    Lower 90%  Upper 90%
kT [keV]    : 10.4920  (-2.37936  3.42998)
R^2/D10^2   : 0.332826  (-0.219107   0.543137)
(R is the radius in km and D10 is the distance to the source in units of 10 kpc)
------------------------------------------------------------
#Fit statistic : Chi-Squared =          56.02 using 59 PHA bins.
# Reduced chi-squared =         0.9828 for     57 degrees of freedom
# Null hypothesis probability =   5.117702e-01

Energy  Fluence     90% Error
[keV]   [erg/cm2]   [erg/cm2]
15- 25  7.571e-09   3.689e-09
25- 50  2.012e-08   7.911e-09
50-150  1.204e-08   7.455e-09
15-150  3.973e-08   1.777e-08
Thermal bremsstrahlung (OTTB)
Spectral model: thermal bremsstrahlung
------------------------------------------------------------
Parameters  : value         Lower 90%    Upper 90%
kT [keV]    : 87.4338       (-44.5914      -87.4338)
Norm        : 3.75102       (-1.0298     1.56796)
------------------------------------------------------------
#Fit statistic : Chi-Squared =          54.47 using 59 PHA bins.
# Reduced chi-squared =         0.9556 for     57 degrees of freedom
# Null hypothesis probability =   5.705570e-01

Energy  Fluence     90% Error
[keV]   [erg/cm2]   [erg/cm2]
15- 25  9.778e-09   3.081e-09
25- 50  1.643e-08   8.509e-09
50-150  2.458e-08   1.924e-08
15-150  5.078e-08   3.091e-08
Double BB
Spectral model: bbodyrad<1> + bbodyrad<2>
------------------------------------------------------------
Parameters  : value         Lower 90%    Upper 90%
kT1 [keV]   : 7.69232        (-7.85988      3.84598)
R1^2/D10^2  : 0.780771        (-0.757302      -0.757302)
kT2 [keV]   : 23.4808        (-24.8876      -24.8876)
R2^2/D10^2  : 8.46680E-03    (-0.00749858   0.405701)
------------------------------------------------------------
#Fit statistic : Chi-Squared =          53.50 using 59 PHA bins.
# Reduced chi-squared =         0.9727 for     55 degrees of freedom
# Null hypothesis probability =   5.321428e-01

Energy  Fluence     90% Error
[keV]   [erg/cm2]   [erg/cm2]
15- 25  8.939e-09   5.875e-09
25- 50  1.783e-08   1.047e-08
50-150  2.196e-08   1.432e-08
15-150  4.872e-08   2.812e-08
Plot creation:
Sat Feb  4 08:59:18 EST 2017