batgrbproduct analysis for trigger=1058804
batgrbproduct Analysis for Trigger=1058804
Analysis Summary
Notes:
- 1) No attempt has been made to eliminate the non-significant decimal places.
- 2) This batgrbproduct analysis is done using the HEASARC data.
- 3) This batgrbproduct analysis is using the flight position for the mask-weighting calculation.
Sepcial note:
Due to the low partial coding fraction of this burst, the light curves and burst durations are created using the special DETECTION mask aperture. However, the spectral analysis are done using the default FLUX aperture for more accurate results, and thus the spectral analysis is only available after T+18.008 s (met=646945679 s; see figure below), when the burst came into the BAT calibrated field of view.
FLUX-mask-weighted light curve (pcodethresh=0.05; aperture=CALDB:FLUX)

======================================================================
                  BAT GRB EVENT DATA PROCESSING REPORT
    Process Script Ver: batgrbproduct v2.48
    Process Start Time (local time): Sun Jul  4 10:38:29 EDT 2021
             Host Name: batproc1
   Current Working Dir: /local/data/bat1/prebascript/trigger1058804/batgroup_hand_proc
======================================================================

  Trigger: 01058804      Segment: 000

  BAT Trigger Time: 646945660.992   [s; MET]
      Trigger Stop: 646945662.016   [s; MET]
               UTC: 2021-07-02T19:07:13.691440    [includes UTCF correction]
       Where From?: TDRSS position message

  BAT
    RA: 168.569805415435   Dec: -36.741422872714  [deg; J2000]

     Catalogged Source?: NO
     Point Source?:      YES
     GRB Indicated?:     YES    [ by BAT flight software ]
     Image S/N Ratio:    6.99
     Image Trigger?:     NO
     Rate S/N Ratio:     95.0683964312011  [ if not an image trigger ]
     Image S/N Ratio:    6.99

  Flight Position:   [ source = BAT ]
    RA: 168.569805415435   Dec: -36.741422872714  [deg; J2000]

  Ground Position:   [ source = BAT pre-slew burst ]
    RA: 168.56985   Dec: -36.74145  [deg; J2000]
        { 11h 14m 16.8s , -36d -44' -29.2" }
        +/- 1.49928384125 [arcmin] (estimated 90% radius based on SNR)
    SNR: 17.05738845865164


  Angular difference between Flight and Ground position is 0.002692 arcmin

  Partial Coding Fraction: 0.04199219    [ including projection effects ]

  Duration
     T90: 138.151999950409 +/- 47.5996473174201
        Measured from: -2.46399998664856
                   to: 135.68799996376     [s; relative to TRIGTIME]
     T50: 31.9759999513626 +/- 4.78609198481258
        Measured from: 1.06400001049042
                   to: 33.039999961853     [s; relative to TRIGTIME]


  Fluence
     Peak Flux  (peak 1 second)
        Measured from: 0.644000053405762
                   to: 1.64400005340576     [s; relative to TRIGTIME]
     Total Fluence
        Measured from: -3.64800000190735
                   to: 369.215999960899     [s; relative to TRIGTIME]

             Band 1     Band 2     Band 3     Band 4
              15-25      25-50     50-100    100-350     keV
 Total     7.749349  12.390532  13.424999   5.693927
           0.321195   0.374209   0.389027   0.381329 [error]
 Peak      0.246264   0.806592   0.828630   0.678501
           0.068491   0.085345   0.090169   0.088273 [error]

     [ fluence units of on-axis counts / fully illuminated detector ]

======================================================================

=== Fluence/Peak Flux Summary ===

              Model    Band1    Band2    Band3    Band4    Band5    Total
                       15-25    25-50   50-100  100-350   15-150   15-350   keV
Fluence   Power-law 1.38e-06 2.47e-06 3.41e-06 9.80e-06 9.83e-06 1.71e-05   erg/cm2
              Error 1.19e-07 1.24e-07 2.18e-07 1.39e-06 5.16e-07 1.54e-06   erg/cm2
Peak flux Power-law -------- -------- -------- -------- -------- --------   ph/cm2/s
              Error -------- -------- -------- -------- -------- --------   ph/cm2/s

Fluence   Cutoff-PL 1.35e-06 2.49e-06 3.44e-06 8.32e-06 9.76e-06 1.56e-05   erg/cm2
              Error 1.28e-07 1.39e-07 2.31e-07 2.48e-06 5.68e-07 2.58e-06   erg/cm2
Peak flux Cutoff-PL -------- -------- -------- -------- -------- --------   ph/cm2/s
              Error -------- -------- -------- -------- -------- --------   ph/cm2/s

Fluence        Band -------- -------- -------- -------- -------- --------   erg/cm2
              Error -------- -------- -------- -------- -------- --------   erg/cm2
Peak flux      Band -------- -------- -------- -------- -------- --------   ph/cm2/s
              Error -------- -------- -------- -------- -------- --------   ph/cm2/s
=== Time-averaged spectral analysis ===

Model Ph_index Ph_90err Epeak  Epeak_90err Norm     Nomr_90err chi2   dof
PL    1.535    0.089    -      -           2.97e-03 1.42e-04   54.030 57
CPL   1.425    0.270     273.5    0.0      3.35e-03 1.03e-03   53.720 56


(1-s peak spectrum is not available)

Model      : spectral model: simple power-law (PL) and cutoff power-law (CPL)
Ph_index   : photon index: E^-{Ph_index} (minus sign is not included in the index)
Ph_90err   : 90% error of the photon index
Epeak      : Epeak in keV
Epeak_90err: 90% error of Epeak
Norm       : normalization at 50 keV in PL model and at 1 keV in CPL model
Nomr_90err : 90% error of the normalization
chi2       : Chi-Squared
dof        : degree of freedom
=== T90/T50 calculation in the 50-300 keV band (BATSE band) using 64 ms lc ===

T90 in the 50-300 keV band: 129.856000 sec.
T50 in the 50-300 keV band: 21.696000 sec.
=== Table of the duration information ==

        Value   tstart    tstop
T100  372.864   -3.648  369.216
T90   138.152   -2.464  135.688
T50    31.976    1.064   33.040
Peak    1.000    0.644    1.644
Image
Pre-slew 15.0-350.0 keV image (Event data)

#   RAcent    DECcent   POSerr    Theta     Phi              Peak Cts       SNR       Name
  168.56985 -36.74145   0.0       60.2836   -157.8916        23.3804        17.0574   TRIG_01058804

Foreground time interval of the image:
 -3.648  10.0 (delta_t =  13.648 [sec])
Lightcurves
Notes:
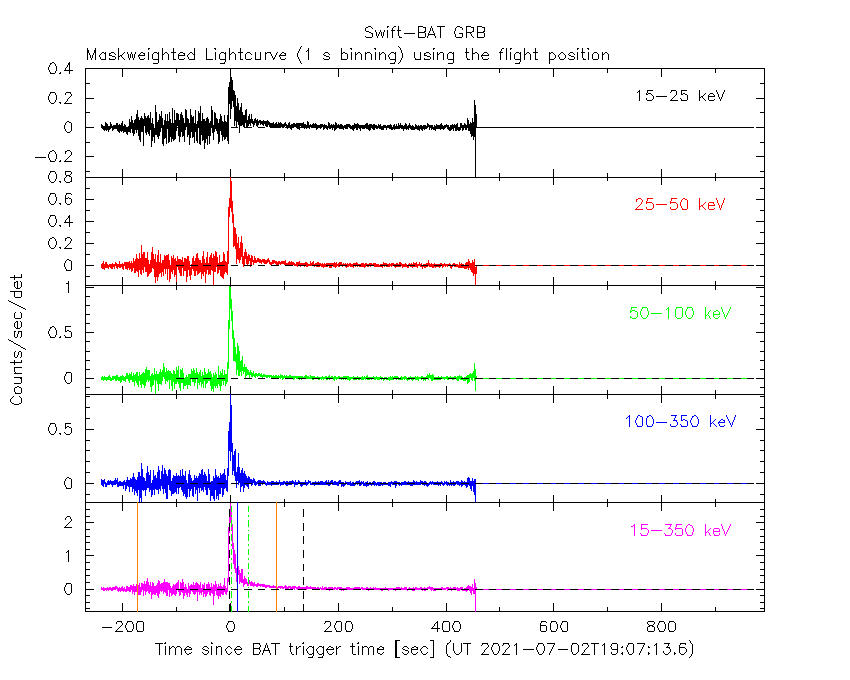
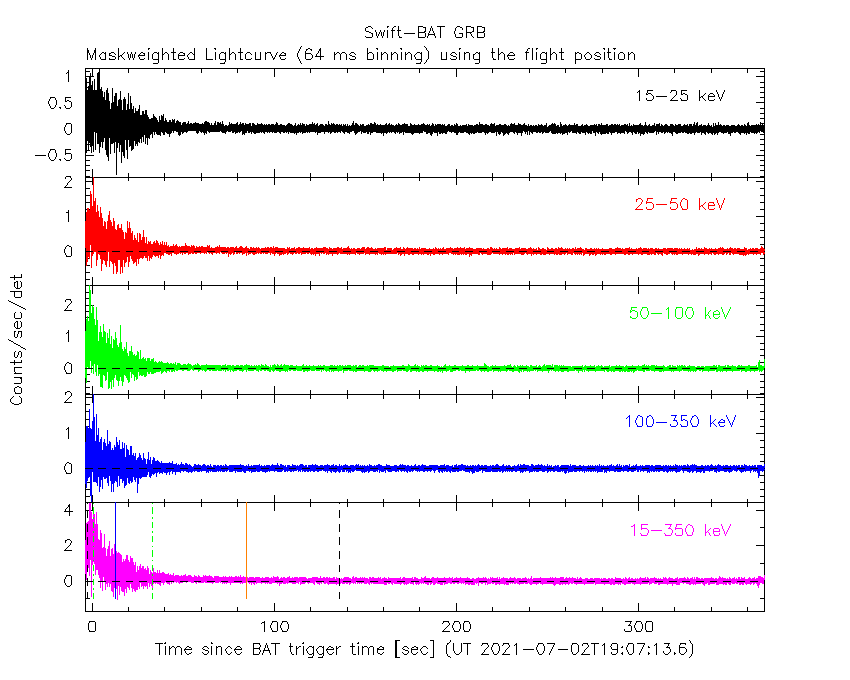
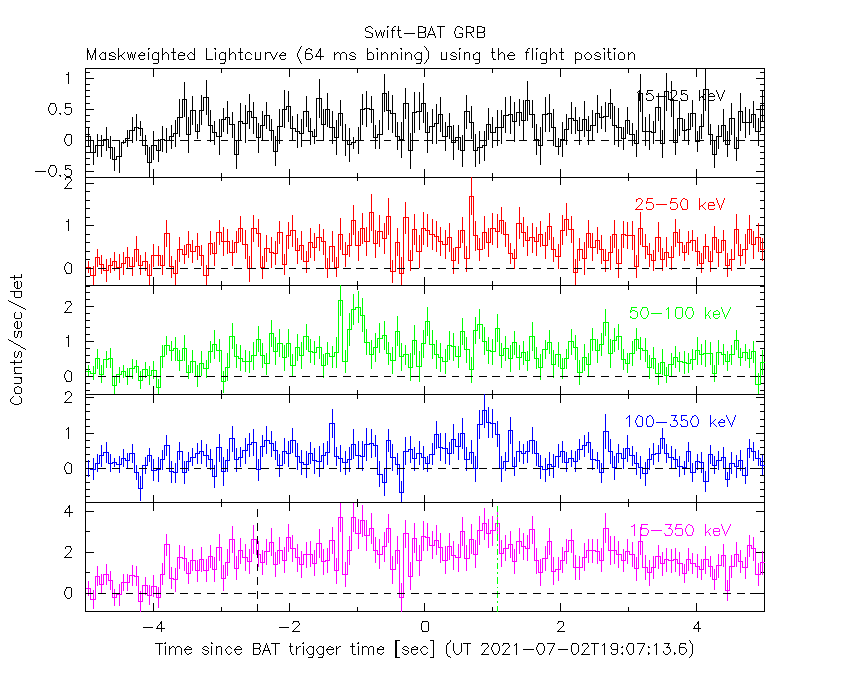
- 1) The mask-weighted light curves are using the flight position.
- 2) Multiple plots of different time binning/intervals are shown to cover all scenarios of short/long GRBs, rate/image triggers, and real/false positives.
- 3) For all the mask-weighted lightcurves, the y-axis units are counts/sec/det where a det is 0.4 x 0.4 = 0.16 sq cm.
- 4) The verticle lines correspond to following: green dotted lines are T50 interval, black dotted lines are T90 interval, blue solid line(s) is a spacecraft slew start time, and orange solid line(s) is a spacecraft slew end time.
- 5) Time of each bin is in the middle of the bin.
1 s binning
From T0-310 s to T0+310 s

From T100_start - 20 s to T100_end + 30 s
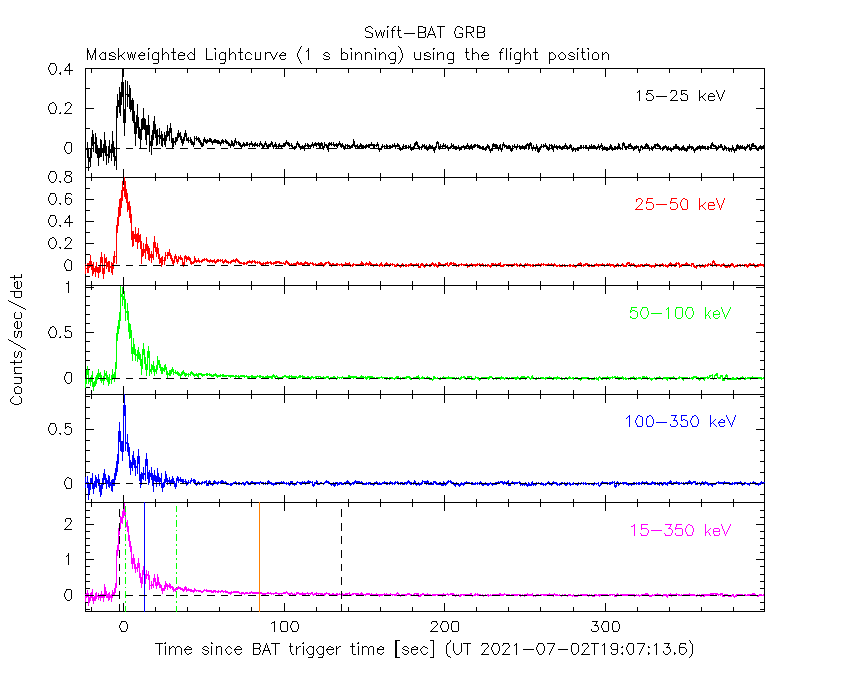
Full time interval
64 ms binning
Full time interval

From T100_start to T100_end
From T0-5 sec to T0+5 sec
16 ms binning
From T100_start-5 s to T100_start+5 s

8 ms binning
From T100_start-3 s to T100_start+3 s
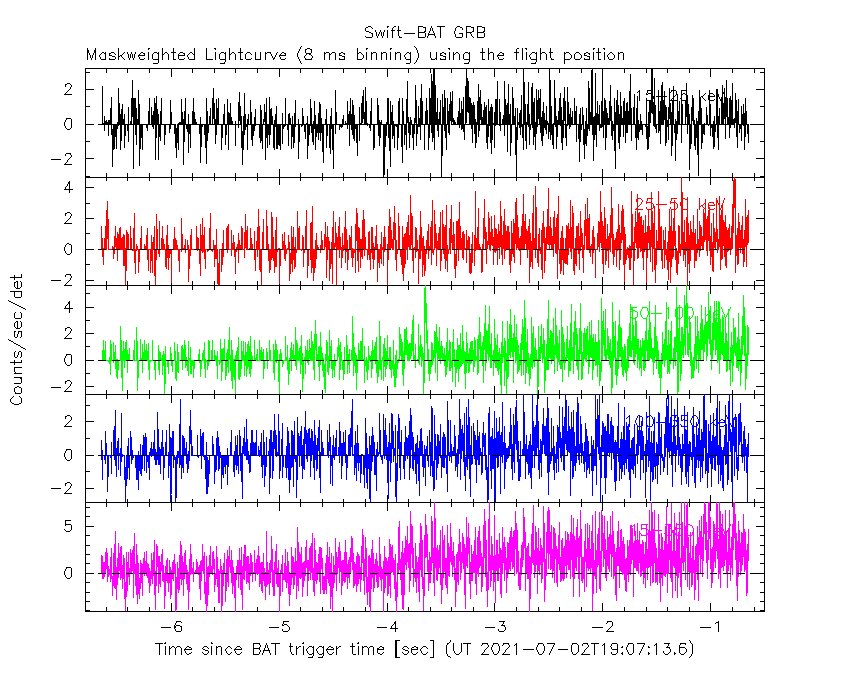
2 ms binning
From T100_start-1 s to T100_start+1 s

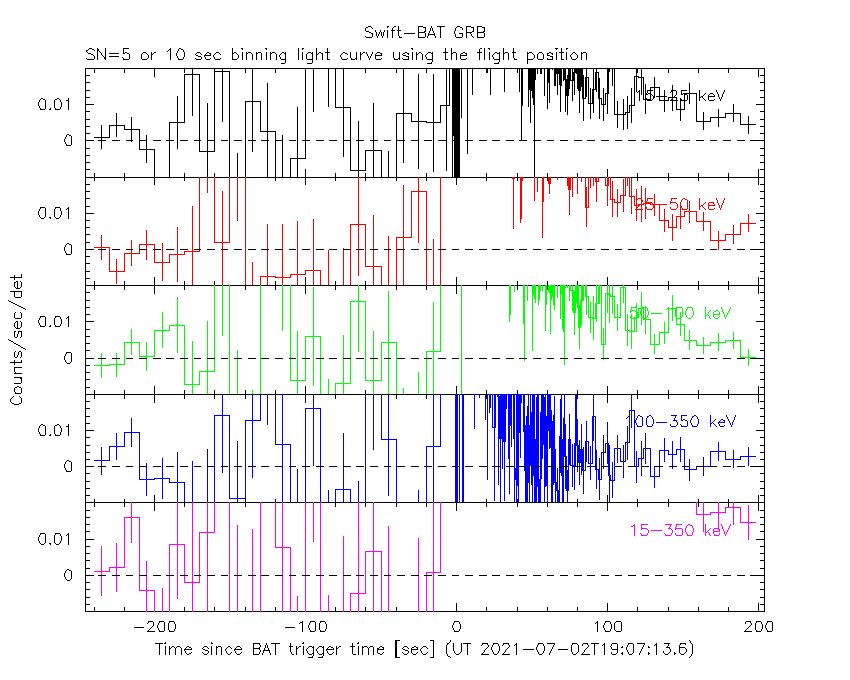
SN=5 or 10 sec. binning (whichever binning is satisfied first)
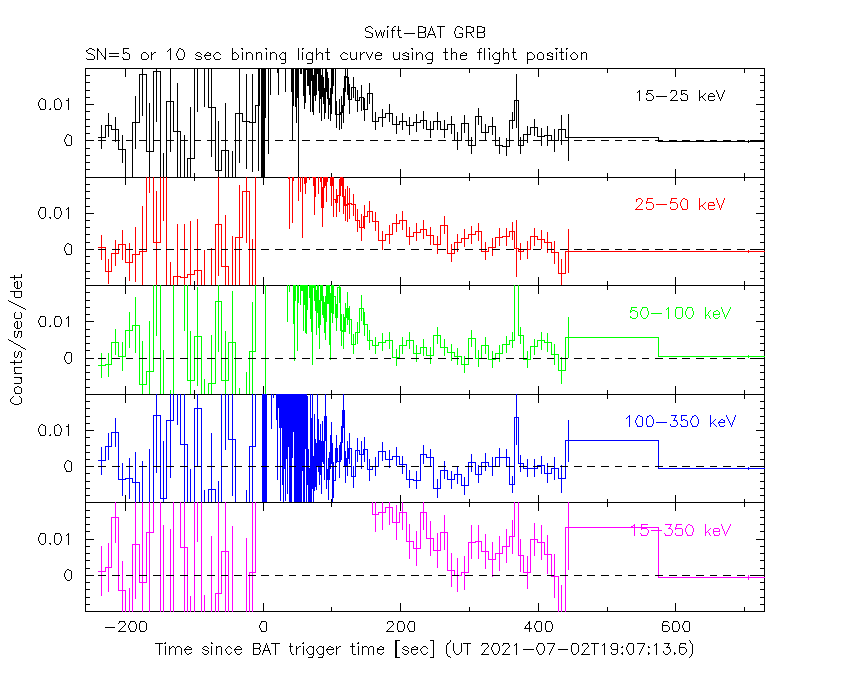
SN=5 or 10 sec. binning (T < 200 sec)
Spectra
Notes:
- 1) The fitting includes the systematic errors.
- 2) When the burst includes telescope slew time periods, the fitting uses an average response file made from multiple 5-s response files through out the slew time plus single time preiod for the non-slew times, and weighted by the total counts in the corresponding time period using addrmf. An average response file is needed becuase a spectral fit using the pre-slew DRM will introduce some errors in both a spectral shape and a normalization if the PHA file contains a lot of the slew/post-slew time interval.
- 3) For fits to more complicated models (e.g. a power-law over a cutoff power-law), the BAT team has decided to require a chi-square improvement of more than 6 for each extra dof.
Time averaged spectrum fit using the average DRM
Power-law model
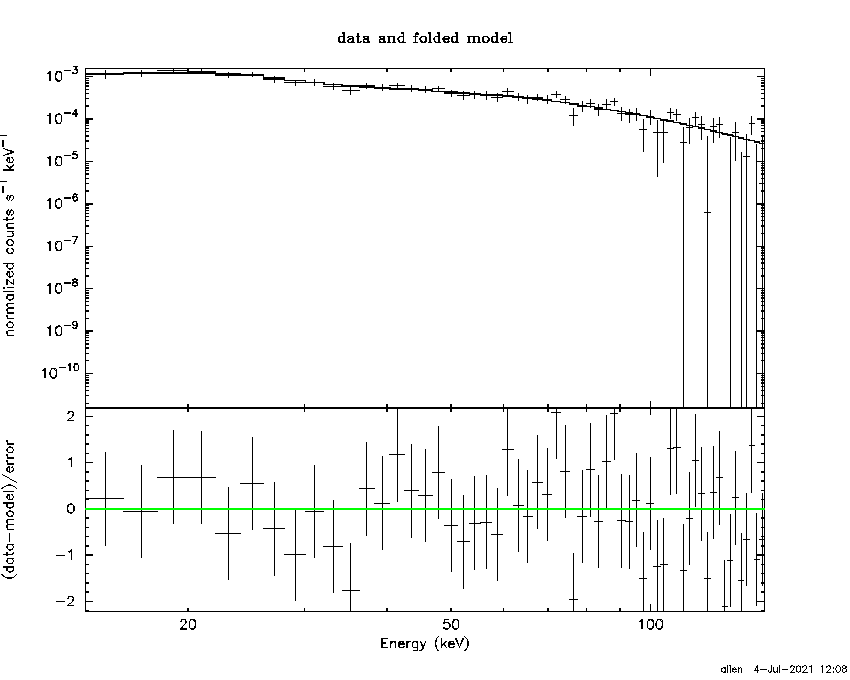
Time interval is from   18.008 sec. to  369.216 sec.

Spectral model in power-law:
------------------------------------------------------------
Parameters  : value       lower 90%   higher 90%
Photon index: 1.53519     ( -0.0890221   0.0897133 )
Norm@50keV  : 2.96744E-03    ( -0.000142394   0.000141769 )
------------------------------------------------------------
#Fit statistic  : Chi-Squared                   54.03     using 59 bins.
 Reduced chi-squared = 0.947895
# Null hypothesis probability of 5.87e-01 with 57 degrees of freedom

Photon flux (15-150 keV)    in 351.2 sec: 0.374081 ( -0.018197  0.018252 ) ph/cm2/s
Energy fluence (15-150 keV)             : 9.83364e-06 ( -5.1474e-07  5.17655e-07 ) ergs/cm2
Cutoff power-law model
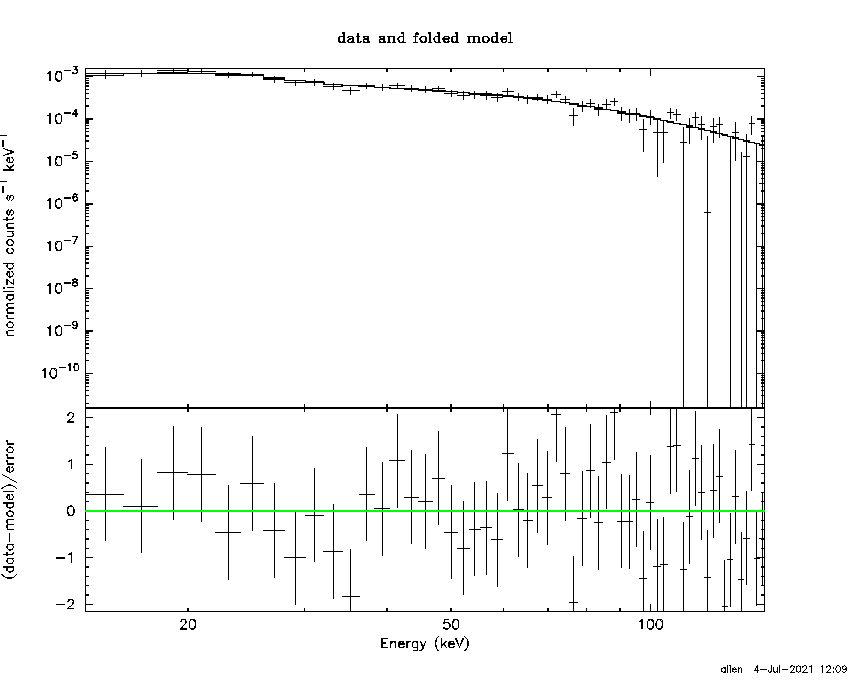
Time interval is from   18.008 sec. to  369.216 sec.
Spectral model in the cutoff power-law:
------------------------------------------------------------
Parameters  : value       lower 90%   higher 90%
Photon index: 1.42549     ( -0.35104   0.188457 )
Epeak [keV] : 273.521      ( -273.485 -273.485 )
Norm@50keV  : 3.35186E-03    ( -0.000510312   0.00154251 )
------------------------------------------------------------
#Fit statistic  : Chi-Squared                   53.72     using 59 bins.
 Reduced chi-squared = 0.959286
# Null hypothesis probability of 5.62e-01 with 56 degrees of freedom

Photon flux (15-150 keV)    in 351.2 sec: 0.371376 ( -0.019858  0.019271 ) ph/cm2/s
Energy fluence (15-150 keV)             : 9.74977e-06 ( -5.73745e-07  5.62507e-07 ) ergs/cm2
Band function
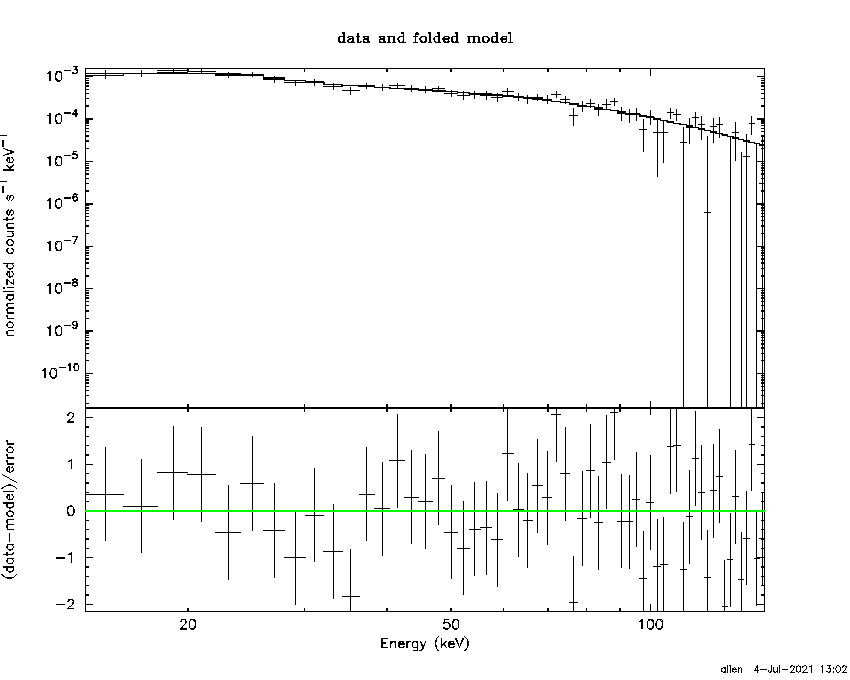
Time interval is from   18.008 sec. to  369.216 sec.


Spectral model in the Band function:
------------------------------------------------------------
Parameters  : value       lower 90%   higher 90%
alpha       : -1.42562   ( 1.28972   1.28972 )
beta        : -10.0000    ( 10   3.55271e-15 )
Epeak [keV] : 273.727      ( -124.574 -273.727 )
Norm@50keV   : 3.35087E-03    ( -0.000223972   0.00154363 )
------------------------------------------------------------

Photon flux (15-150 keV)    in 351.2 sec:  (    ) ph/cm2/s
Energy fluence (15-150 keV)             : 0 ( 0  0 ) ergs/cm2
Single BB
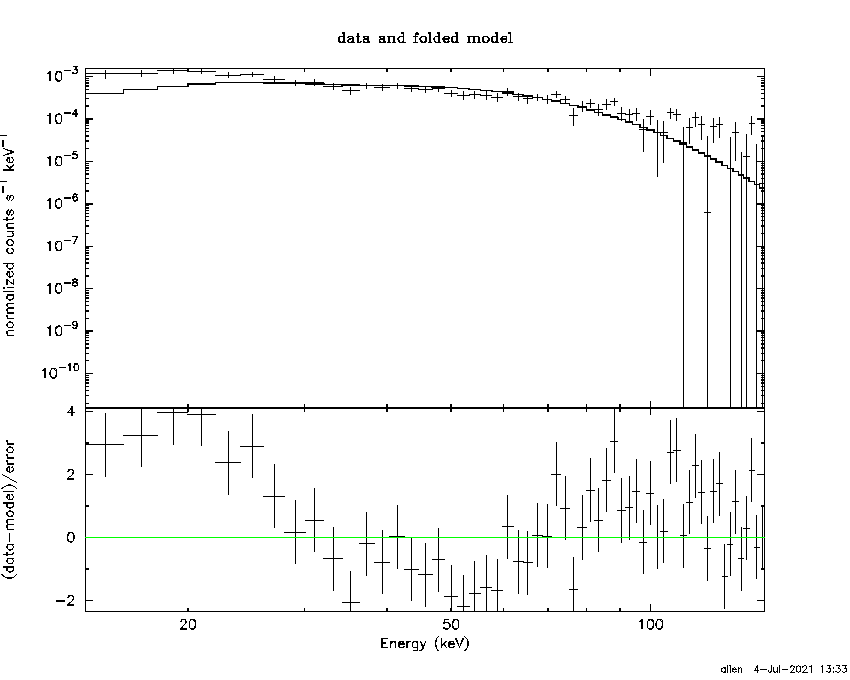
Spectral model blackbody:
------------------------------------------------------------
Parameters  : value    Lower 90%  Upper 90%
kT [keV]    : 15.8431  (  )
R^2/D10^2   : 3.37337E-02  (   )
(R is the radius in km and D10 is the distance to the source in units of 10 kpc)
------------------------------------------------------------
#Fit statistic  : Chi-Squared                  157.96     using 59 bins.
 Reduced chi-squared =
# Null hypothesis probability of 2.02e-11 with 57 degrees of freedom

Energy  Fluence     90% Error
[keV]   [erg/cm2]   [erg/cm2]
15- 25  6.162e-07   6.006e-08
25- 50  2.571e-06   1.542e-07
50-150  4.494e-06   4.302e-07
15-150  7.681e-06   4.741e-07
Thermal bremsstrahlung (OTTB)
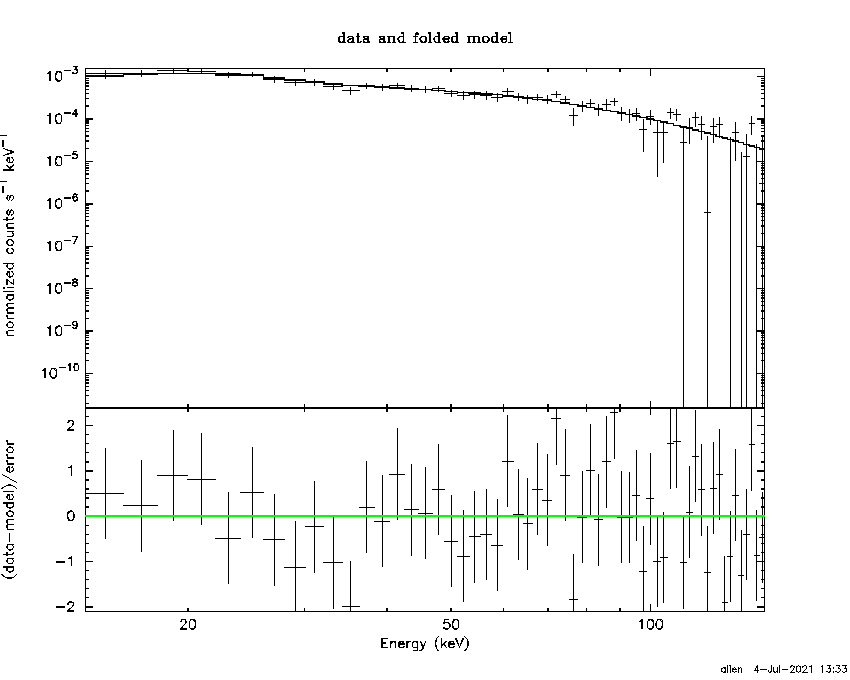
Spectral model: thermal bremsstrahlung
------------------------------------------------------------
Parameters  : value         Lower 90%    Upper 90%
kT [keV]    : 200.000       (-32.0633      -200)
Norm        : 1.51718       (-0.0706744     0.0706744)
------------------------------------------------------------
#Fit statistic  : Chi-Squared                   55.34     using 59 bins.
 Reduced chi-squared =
# Null hypothesis probability of 5.37e-01 with 57 degrees of freedom

Energy  Fluence     90% Error
[keV]   [erg/cm2]   [erg/cm2]
15- 25  1.327e-06   6.866e-08
25- 50  2.553e-06   1.322e-07
50-150  5.599e-06   3.881e-07
15-150  9.480e-06   4.934e-07
Double BB

Spectral model: bbodyrad<1> + bbodyrad<2>
------------------------------------------------------------
Parameters  : value         Lower 90%    Upper 90%
kT1 [keV]   : 5.29241        (-0.906626      1.10676)
R1^2/D10^2  : 1.06530        (-0.560559      1.33652)
kT2 [keV]   : 22.7269        (-2.42063      3.30121)
R2^2/D10^2  : 8.32276E-03    (-0.00324462   0.00426393)
------------------------------------------------------------
#Fit statistic  : Chi-Squared                   52.90     using 59 bins.
 Reduced chi-squared =
# Null hypothesis probability of 5.55e-01 with 55 degrees of freedom

Energy  Fluence     90% Error
[keV]   [erg/cm2]   [erg/cm2]
15- 25  1.411e-06   3.061e-07
25- 50  2.334e-06   2.560e-07
50-150  5.768e-06   7.200e-07
15-150  9.514e-06   1.194e-06
Plot creation:
Sun Jul  4 13:34:22 EDT 2021


