| UTC | Image Fluence | Image Duration (s) | delta T (s) |
| 2006-03-25 10:12:04 | 0.363 | 0.032 | |
| 2006-03-25 18:07:20 | 0.040 | 0.128 | 28516 |
| 2006-03-25 18:07:20 | 0.032 | 0.064 | |
| 2006-03-25 20:16:40 | 0.010 | 0.008 | 7761 |
| 2006-03-25 23:34:07 | 0.006 | 0.032 | 11846 |
| 2006-03-26 00:59:22 | 0.011 | 0.016 | 5115 |
| 2006-03-26 13:30:04 | 0.008 | 0.016 | 45042 |
| 2006-03-26 16:50:17 | 0.008 | 0.008 | 12013 |
| 2006-03-28 01:00:15 | 0.023 | 0.008 | 115799 |
| 2006-03-28 11:57:22 | 0.029 | 0.016 | 39426 |
| 2006-03-28 11:59:15 | 0.104 | 0.032 | 113 |
| 2006-03-28 20:11:28 | 0.018 | 0.128 | 29533 |
| 2006-03-28 20:32:30 | 0.015 | 0.008 | 1262 |
| 2006-03-28 21:37:02 | 0.026 | 0.032 | 3872 |
| 2006-03-28 23:10:07 | 0.041 | 0.128 | 5584 |
| 2006-03-28 23:10:07 | 0.017 | 0.032 | |
| 2006-03-29 00:56:01 | 0.089 | 0.032 | 6355 |
| 2006-03-29 01:14:08 | 0.019 | 0.128 | 1086 |
| 2006-03-29 01:14:08 | 0.014 | 0.064 | |
| 2006-03-29 01:15:44 | 0.069 | 0.016 | 96 |
| 2006-03-29 01:28:04 | 1.029 | 0.128 | 740 |
| 2006-03-29 02:39:43 | 1.539 | 136 | 4299 |
| 2006-03-29 02:39:43 | 3.656 | 336 | |
| 2006-03-29 02:40:02 | 0.017 | 0.016 | 20 |
| 2006-03-29 02:40:05 | 0.097 | 0.032 | 3 |
| 2006-03-29 02:40:51 | 0.762 | 0.128 | 46 |
| 2006-03-29 02:40:51 | 0.822 | 0.512 | |
| 2006-03-29 02:40:51 | 0.287 | 0.016 | |
| 2006-03-29 02:41:59 | 2.098 | 136 | 68 |
| 2006-03-29 02:42:11 | 0.013 | 0.008 | 12 |
| 2006-03-29 02:42:25 | 0.195 | 0.032 | 15 |
| 2006-03-29 02:43:10 | 0.036 | 0.016 | 44 |
| 2006-03-29 02:43:25 | 1.070 | 16.384 | 15 |
| 2006-03-29 02:43:33 | 0.865 | 0.128 | 8 |
| 2006-03-29 02:43:33 | 0.339 | 0.016 | |
| 2006-03-29 02:43:45 | 0.264 | 0.256 | 12 |
| 2006-03-29 02:45:29 | 0.051 | 0.008 | 104 |
| 2006-03-29 02:45:29 | 1.906 | 0.128 | |
| 2006-03-29 02:46:32 | 1.351 | 0.512 | 63 |
| 2006-03-29 02:46:32 | 1.203 | 0.128 | |
| 2006-03-29 02:47:04 | 0.215 | 8.192 | 32 |
| 2006-03-29 02:47:46 | 0.089 | 0.016 | 42 |
| 2006-03-29 02:47:50 | 0.500 | 0.128 | 4 |
| 2006-03-29 02:48:46 | 0.011 | 0.016 | 55 |
| 2006-03-29 02:49:02 | 0.028 | 0.032 | 16 |
| 2006-03-29 02:49:42 | 0.212 | 1.024 | 41 |
| 2006-03-29 02:49:43 | 0.242 | 0.256 | 1 |
| 2006-03-29 02:49:43 | 0.199 | 0.064 | |
| 2006-03-29 02:50:21 | 0.125 | 0.256 | 38 |
| 2006-03-29 02:51:11 | 0.076 | 0.064 | 50 |
| 2006-03-29 02:51:27 | 0.203 | 8.192 | 16 |
| 2006-03-29 02:51:30 | 0.204 | 0.032 | 3 |
| 2006-03-29 02:52:22 | 0.046 | 0.064 | 52 |
| 2006-03-29 02:52:37 | 0.152 | 0.016 | 15 |
| 2006-03-29 02:52:37 | 0.965 | 0.128 | |
| 2006-03-29 02:53:09 | 2.585 | 0.128 | 32 |
| 2006-03-29 04:21:27 | 0.907 | 320 | 5298 |
| 2006-03-29 04:23:25 | 0.012 | 0.008 | 118 |
| 2006-03-29 04:23:56 | 0.336 | 8.192 | 31 |
| 2006-03-29 04:23:57 | 0.074 | 0.016 | |
| 2006-03-29 04:23:57 | 0.219 | 0.032 | |
| 2006-03-29 04:24:31 | 0.468 | 72 | 34 |
| 2006-03-29 04:24:33 | 0.117 | 0.016 | 2 |
| 2006-03-29 04:28:14 | 0.010 | 0.032 | 221 |
| 2006-03-29 04:34:51 | 0.034 | 0.128 | 397 |
| 2006-03-29 04:34:51 | 0.019 | 0.032 | |
| 2006-03-29 04:35:18 | 0.070 | 0.032 | 27 |
| 2006-03-29 04:39:46 | 0.279 | 0.128 | 268 |
| 2006-03-29 04:39:46 | 0.227 | 0.064 | |
| 2006-03-29 06:02:22 | 0.026 | 0.008 | 4957 |
| 2006-03-29 07:57:18 | 0.064 | 0.064 | 6896 |
| 2006-03-29 08:00:22 | 0.023 | 0.032 | 184 |
| 2006-03-29 12:19:51 | 0.016 | 0.032 | 15569 |
 Figure 1:
Detected source flux during period of intense activity with 64 ms timescale.
Horizontal zero of the plot (MET 165292691 = 2006-03-29 02:38:10) is the
beginnning of the observation.
Some individual bursts (especially during the storm around +900 seconds in the plot)
caused wrapping in the internal counters and so the vertical scale is truncated.
Figure 1:
Detected source flux during period of intense activity with 64 ms timescale.
Horizontal zero of the plot (MET 165292691 = 2006-03-29 02:38:10) is the
beginnning of the observation.
Some individual bursts (especially during the storm around +900 seconds in the plot)
caused wrapping in the internal counters and so the vertical scale is truncated.
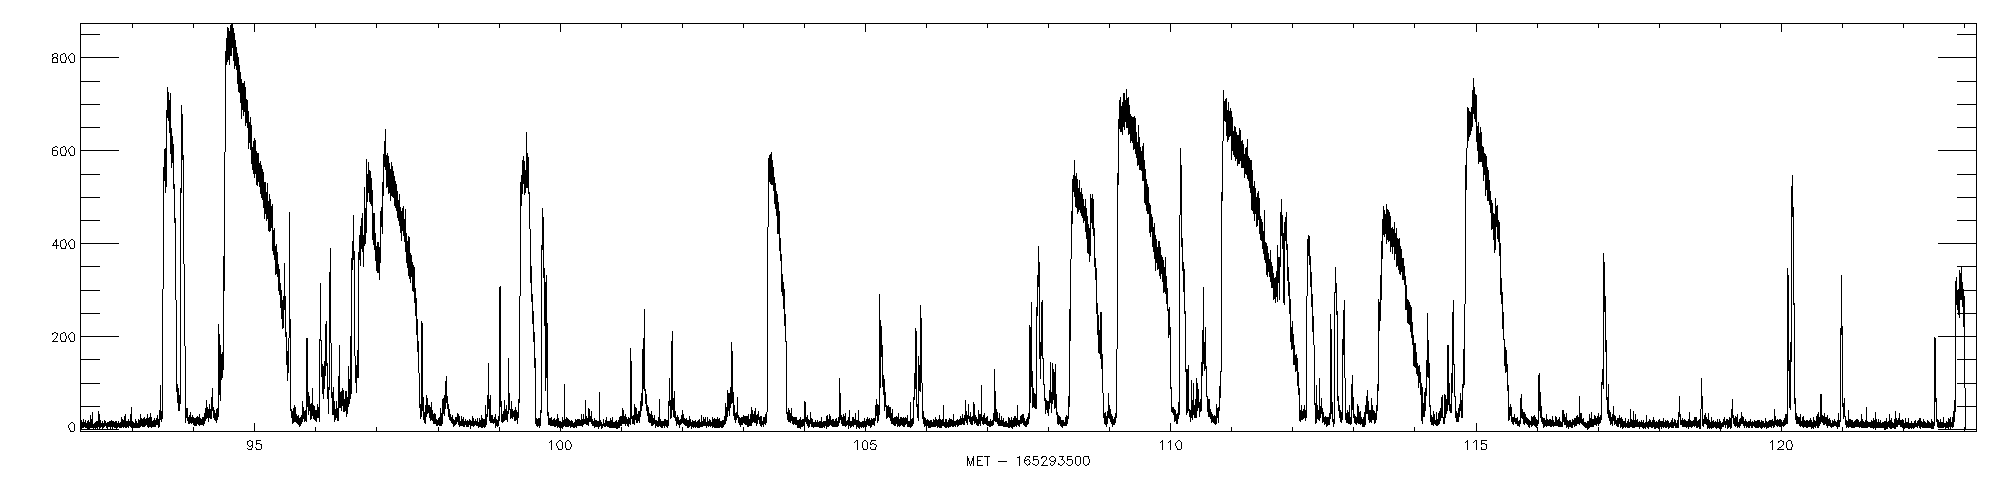 Figure 2:
Detail of the storm plotted with 1ms timescale.
Vertical axis is counts/ms ~12-100 keV.
Horizontal zero of the plot is MET 165293500 = 2006-03-29 02:51:39.
This is a wide plot, you may have to scroll your browser window to the right.
Figure 2:
Detail of the storm plotted with 1ms timescale.
Vertical axis is counts/ms ~12-100 keV.
Horizontal zero of the plot is MET 165293500 = 2006-03-29 02:51:39.
This is a wide plot, you may have to scroll your browser window to the right.
The GCN contact is: Scott Barthelmy,
scott@lheamail.gsfc.nasa.gov, (301)-286-3106