batgrbproduct analysis for trigger=867252
batgrbproduct Analysis for Trigger=867252
Analysis Summary
Notes:
- 1) No attempt has been made to eliminate the non-significant decimal places.
- 2) This batgrbproduct analysis is done of the amount of data for this trigger downloaded to date.
- 3) This batgrbproduct analysis is using the flight position for the mask-weighting calculation.
- 4) This page will be updated for up to 15 downlinks after the trigger.
======================================================================
                  BAT GRB EVENT DATA PROCESSING REPORT
    Process Script Ver: batgrbproduct v2.46
    Process Start Time (local time): Wed Oct 17 01:11:29 EDT 2018
             Host Name: bat1
   Current Working Dir: /local/data/bat1/prebascript/trigger867252/GCN5_download_cron
======================================================================

  Trigger: 00867252      Segment: 000

  BAT Trigger Time: 561344122.688   [s; MET]
      Trigger Stop: 561344139.072   [s; MET]
               UTC: 2018-10-16T00:55:00.927600    [includes UTCF correction]
       Where From?: TDRSS position message

  BAT
    RA: 231.267907712346   Dec: -35.2789249317542  [deg; J2000]

     Catalogged Source?: NO
     Point Source?:      YES
     GRB Indicated?:     YES    [ by BAT flight software ]
     Image S/N Ratio:    8.57
     Image Trigger?:     NO
     Rate S/N Ratio:     7.28010988928052  [ if not an image trigger ]
     Image S/N Ratio:    8.57

  Flight Position:   [ source = BAT ]
    RA: 231.267907712346   Dec: -35.2789249317542  [deg; J2000]

  Ground Position:   [ source = BAT pre-slew burst ]
    RA: 231.273386780453   Dec: -35.3065461076005  [deg; J2000]
        { 15h 25m 05.6s , -35d 18' 23.6" }
         +/- 1.82441360649246 [arcmin] (estimated 90% radius based on SNR)
         +/- 0.88462270747218 [arcmin] (formal 1-sigma fit error)
    SNR: 12.8850198110162

  Angular difference between Flight and Ground position is 1.678852 arcmin

  Partial Coding Fraction: 0.5078125    [ including projection effects ]

  Duration
     T90: 111.603999972343 +/- 26.3256872736196
        Measured from: -12.9519999027252
                   to: 98.6520000696182     [s; relative to TRIGTIME]
     T50: 50.9639999866486 +/- 11.8716759510994
        Measured from: 0.784000158309937
                   to: 51.7480001449585     [s; relative to TRIGTIME]


  Fluence
     Peak Flux  (peak 1 second)
        Measured from: 0.392000079154968
                   to: 1.39200007915497     [s; relative to TRIGTIME]
     Total Fluence
        Measured from: -18.0039999485016
                   to: 110.136000037193     [s; relative to TRIGTIME]

             Band 1     Band 2     Band 3     Band 4
              15-25      25-50     50-100    100-350     keV
 Total     0.748281   1.102460   0.792549   0.332488
           0.115228   0.115199   0.097468   0.083031 [error]
 Peak      0.028759   0.035396   0.015165   0.013338
           0.010803   0.010371   0.009158   0.007471 [error]

     [ fluence units of on-axis counts / fully illuminated detector ]

======================================================================

=== Fluence/Peak Flux Summary ===

              Model    Band1    Band2    Band3    Band4    Band5    Total
                       15-25    25-50   50-100  100-350   15-150   15-350   keV
Fluence   Power-law 2.55e-07 4.67e-07 6.57e-07 1.94e-06 1.88e-06 3.32e-06   erg/cm2
              Error 5.14e-08 5.69e-08 9.76e-08 6.29e-07 2.37e-07 6.99e-07   erg/cm2
Peak flux Power-law 2.93e-01 2.20e-01 1.10e-01 7.92e-02 6.61e-01 7.03e-01   ph/cm2/s
              Error 1.56e-01 8.93e-02 6.58e-02 9.96e-02 2.68e-01 2.86e-01   ph/cm2/s

Fluence   Cutoff-PL 2.55e-07 4.67e-07 6.57e-07 1.92e-06 1.88e-06 3.30e-06   erg/cm2
              Error 5.30e-08 6.02e-08 9.87e-08 7.94e-07 2.41e-07 8.72e-07   erg/cm2
Peak flux Cutoff-PL 2.27e-01 3.01e-01 9.69e-02 4.11e-03 6.29e-01 6.29e-01   ph/cm2/s
              Error 1.76e-01 1.25e-01 9.36e-02 4.33e-02 2.59e-01 2.60e-01   ph/cm2/s

Fluence        Band -------- -------- -------- -------- -------- --------   erg/cm2
              Error -------- -------- -------- -------- -------- --------   erg/cm2
Peak flux      Band -------- -------- -------- -------- -------- --------   ph/cm2/s
              Error -------- -------- -------- -------- -------- --------   ph/cm2/s
=== Time-averaged spectral analysis ===

Model Ph_index Ph_90err Epeak  Epeak_90err Norm     Nomr_90err chi2   dof
PL    1.507    0.203    -      -           1.55e-03 1.79e-04   50.300 57
CPL   1.509    0.280    9999.4    0.0      1.55e-03 1.36e-03   50.310 56


=== 1-s peak spectral analysis ===

Model Ph_index Ph_90err Epeak  Epeak_90err Norm     Nomr_90err chi2   dof
PL    1.991    0.678    -      -           4.42e-03 2.12e-03   70.800 57
CPL  -0.849    4.366      40.0    0.0      2.11e-01 0.00e+00   68.010 56

Model      : spectral model: simple power-law (PL) and cutoff power-law (CPL)
Ph_index   : photon index: E^-{Ph_index} (minus sign is not included in the index)
Ph_90err   : 90% error of the photon index
Epeak      : Epeak in keV
Epeak_90err: 90% error of Epeak
Norm       : normalization at 50 keV in PL model and at 1 keV in CPL model
Nomr_90err : 90% error of the normalization
chi2       : Chi-Squared
dof        : degree of freedom
=== T90/T50 calculation in the 50-300 keV band (BATSE band) using 64 ms lc ===

T90 in the 50-300 keV band: 62.592000 sec.
T50 in the 50-300 keV band: 34.176000 sec.
=== Table of the duration information ==

        Value   tstart    tstop
T100  128.140  -18.004  110.136
T90   111.604  -12.952   98.652
T50    50.964    0.784   51.748
Peak    1.000    0.392    1.392
Image
Pre-slew 15-350 keV image (Event data; bkg subtracted)
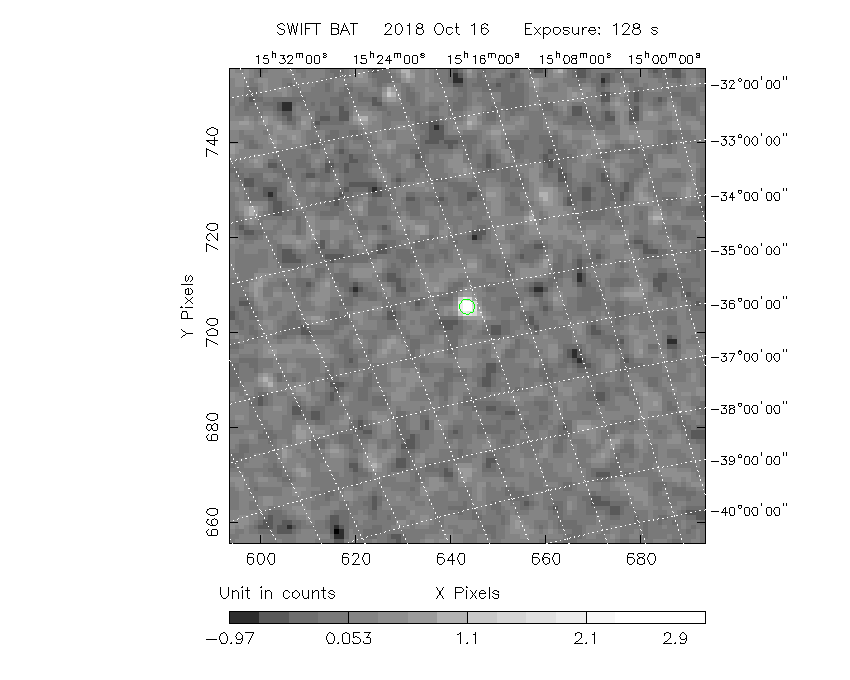
#   RAcent  DECcent POSerr  Theta    Phi     Peak Cts     SNR  Name
  231.2734 -35.3065 0.0150   34.6  -44.1       3.3352    12.9  TRIG_00867252
------------------------------------------

Foreground time interval of the image:
-18.004 110.136 (delta_t = 128.140 [sec])
Background time interval of the image:
-236.487 -18.004 (delta_t = 218.483 [sec])
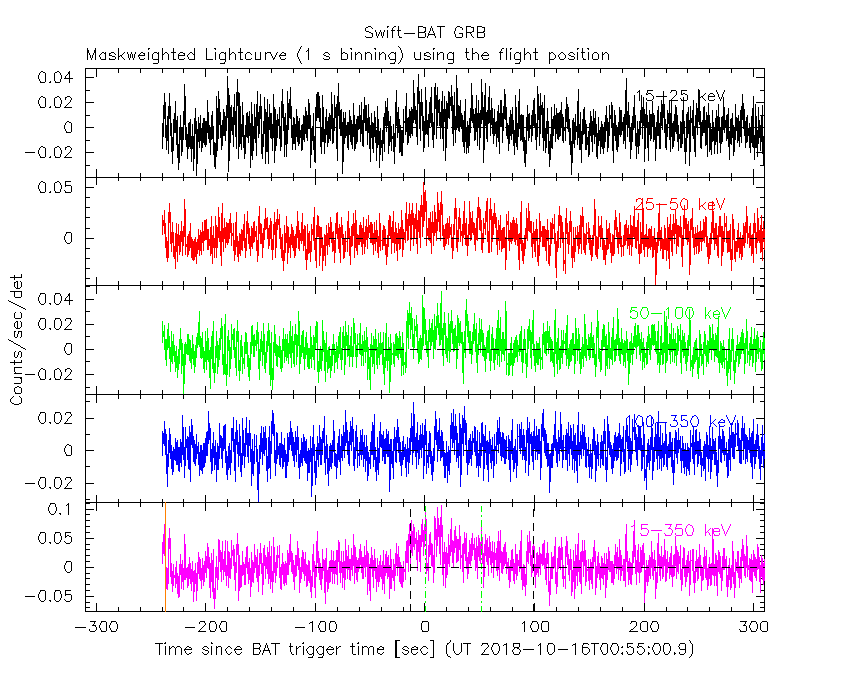
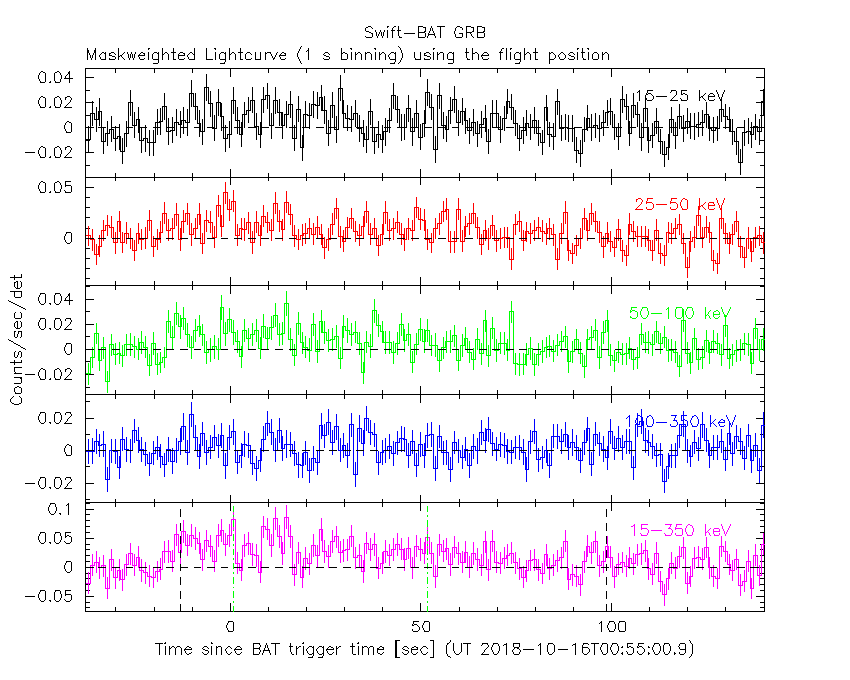
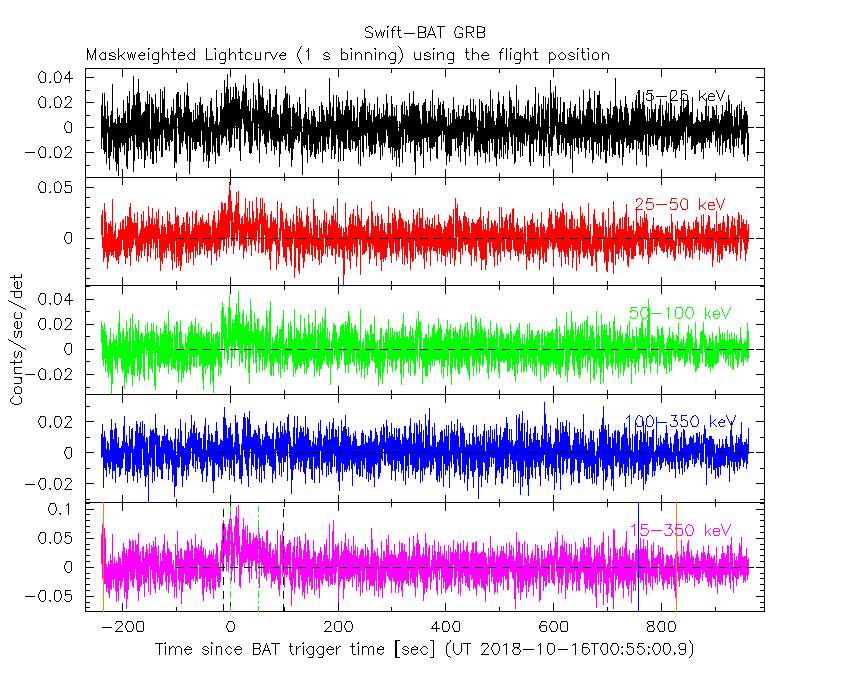
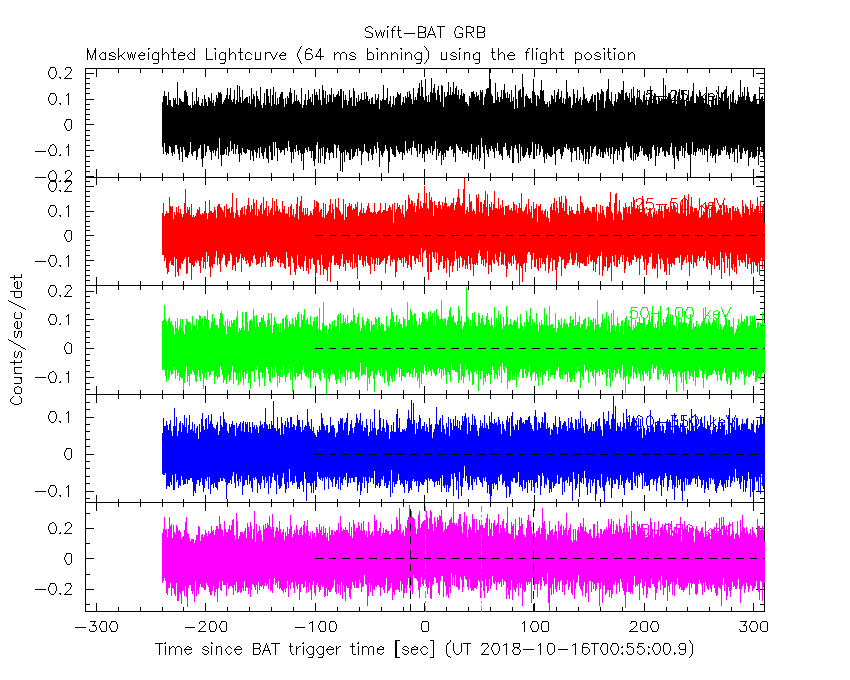
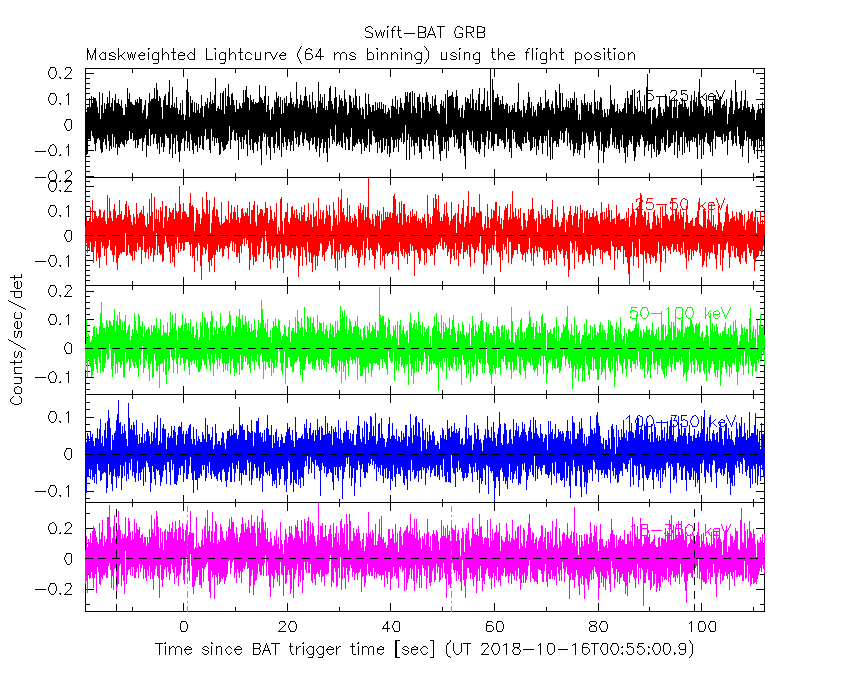
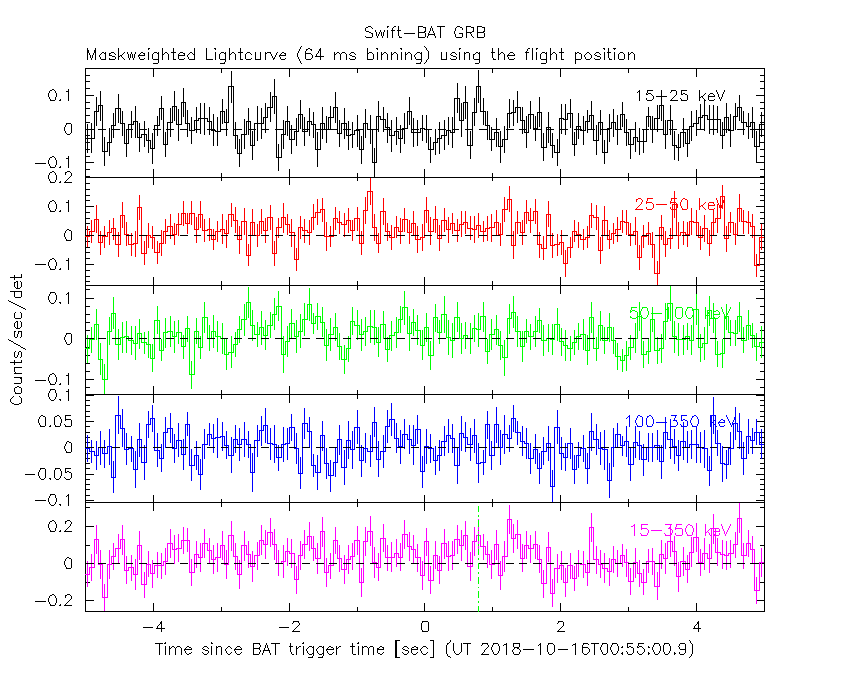
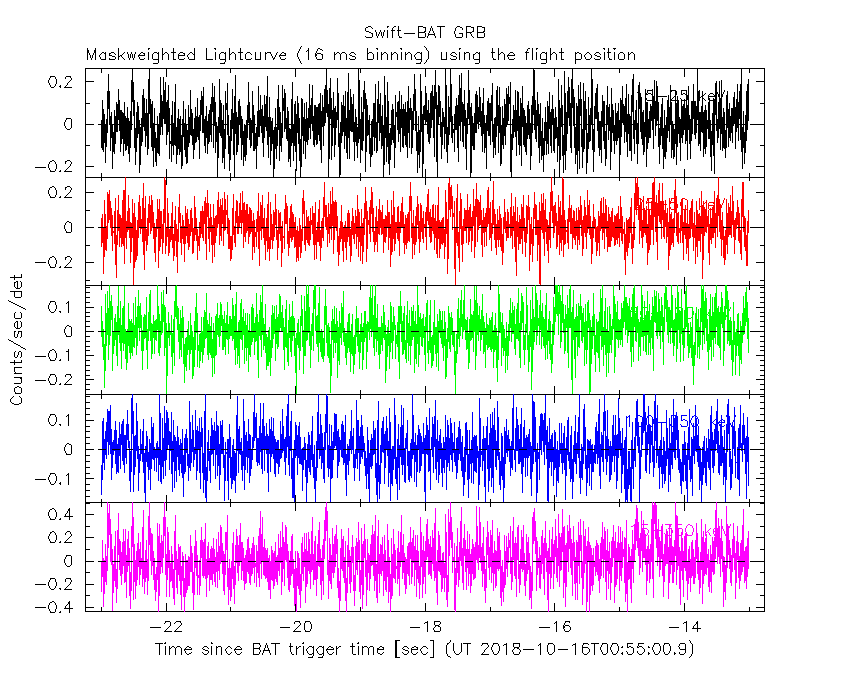
Lightcurves
Notes:
- 1) All plots contain as much data as has been downloaded to date.
- 2) The mask-weighted light curves are using the flight position.
- 3) Multiple plots of different time binning/intervals are shown to cover all scenarios of short/long GRBs, rate/image triggers, and real/false positives.
- 4) For all the mask-weighted lightcurves, the y-axis units are counts/sec/det where a det is 0.4 x 0.4 = 0.16 sq cm.
- 5) The verticle lines correspond to following: green dotted lines are T50 interval, black dotted lines are T90 interval, blue solid line(s) is a spacecraft slew start time, and orange solid line(s) is a spacecraft slew end time.
- 6) Time of each bin is in the middle of the bin.
1 s binning
From T0-310 s to T0+310 s
From T100_start - 20 s to T100_end + 30 s
Full time interval
64 ms binning
Full time interval
From T100_start to T100_end
From T0-5 sec to T0+5 sec
16 ms binning
From T100_start-5 s to T100_start+5 s
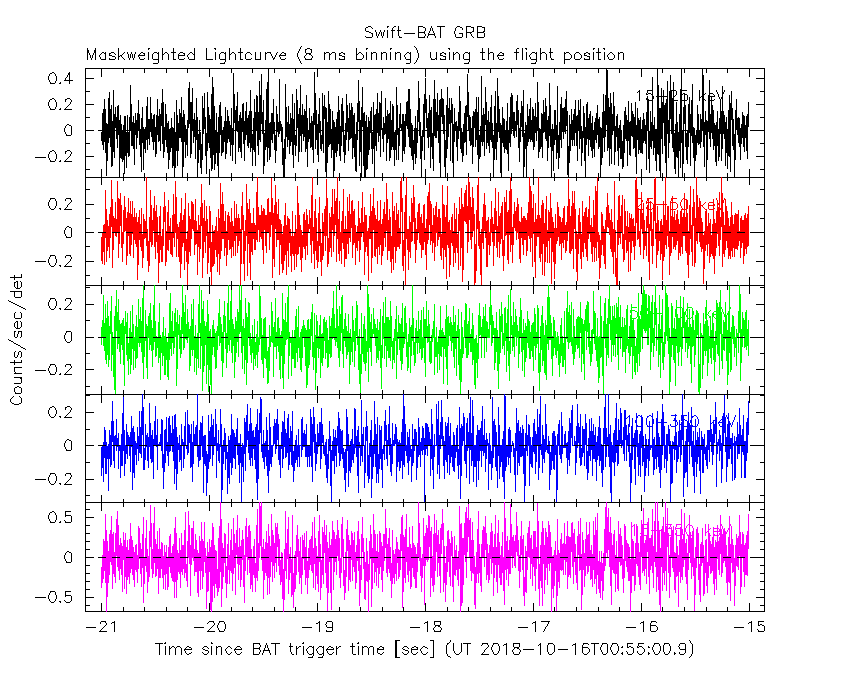
8 ms binning
From T100_start-3 s to T100_start+3 s
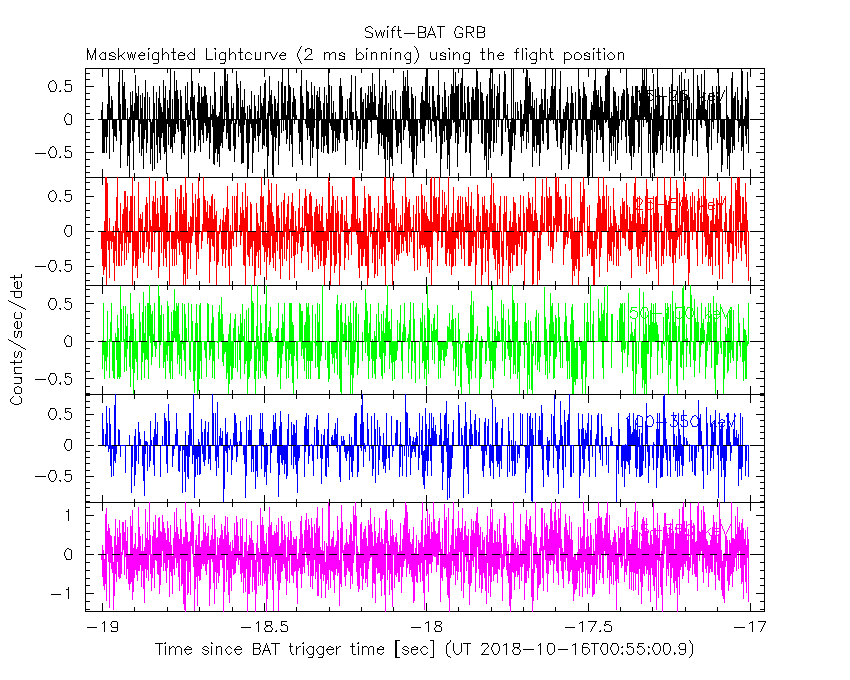
2 ms binning
From T100_start-1 s to T100_start+1 s
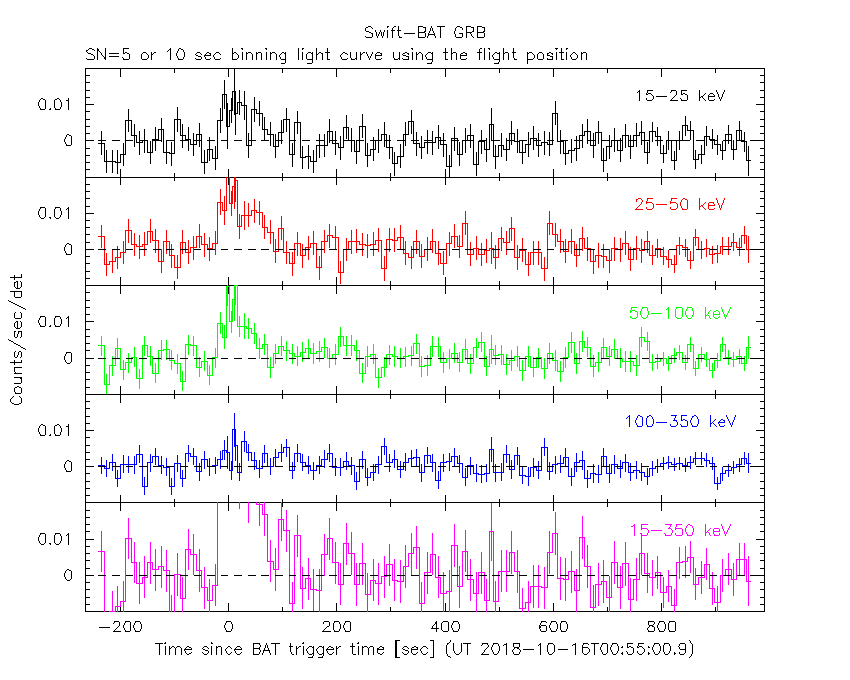
SN=5 or 10 sec. binning (whichever binning is satisfied first)
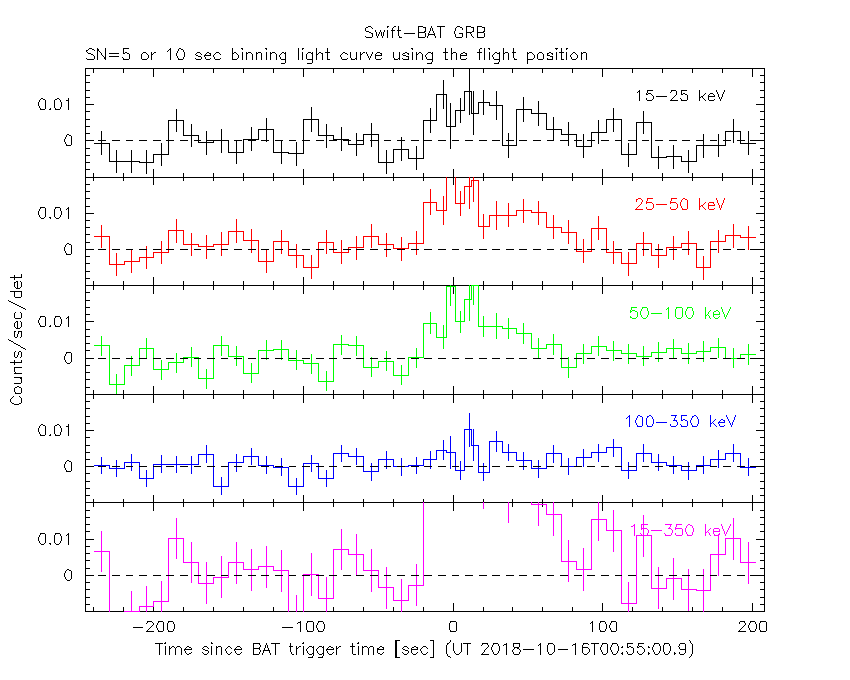
SN=5 or 10 sec. binning (T < 200 sec)
Spectra
Notes:
- 1) The fitting includes the systematic errors.
- 2) For long bursts, a spectral fit of the pre-slew DRM will introduce some errors in both a spectral shape and a normalization if the PHA file contains a lot of the slew/post-slew time interval.
- 3) For fits to more complicated models (e.g. a power-law over a cutoff power-law), the BAT team has decided to require a chi-square improvement of more than 6 for each extra dof.
- 4) For short bursts (T90<1sec), the specrtum is also fit with Blackbody, OTTB, and Double Blackbody.
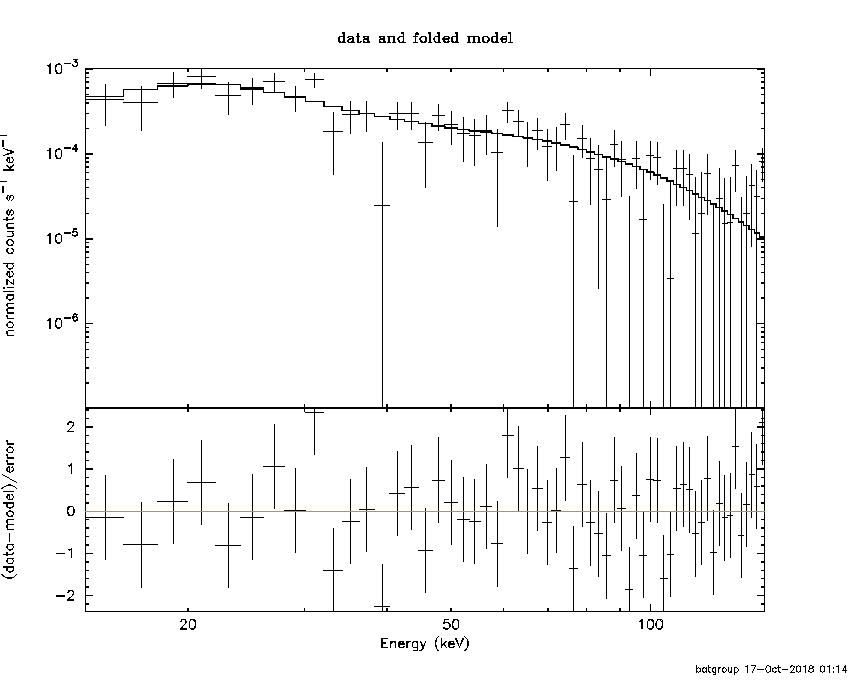
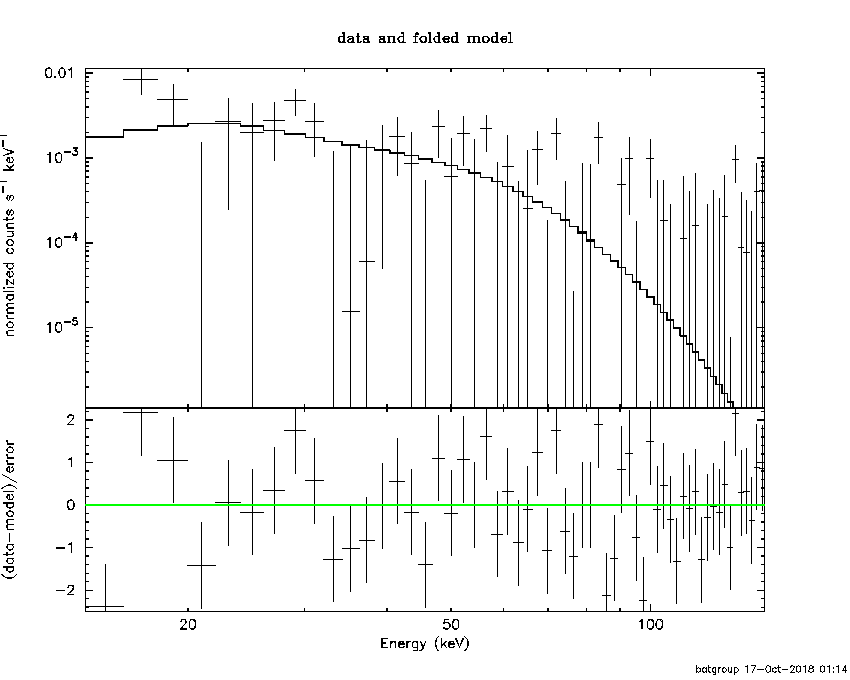
Time averaged spectrum fit using the pre-slew DRM
Power-law model
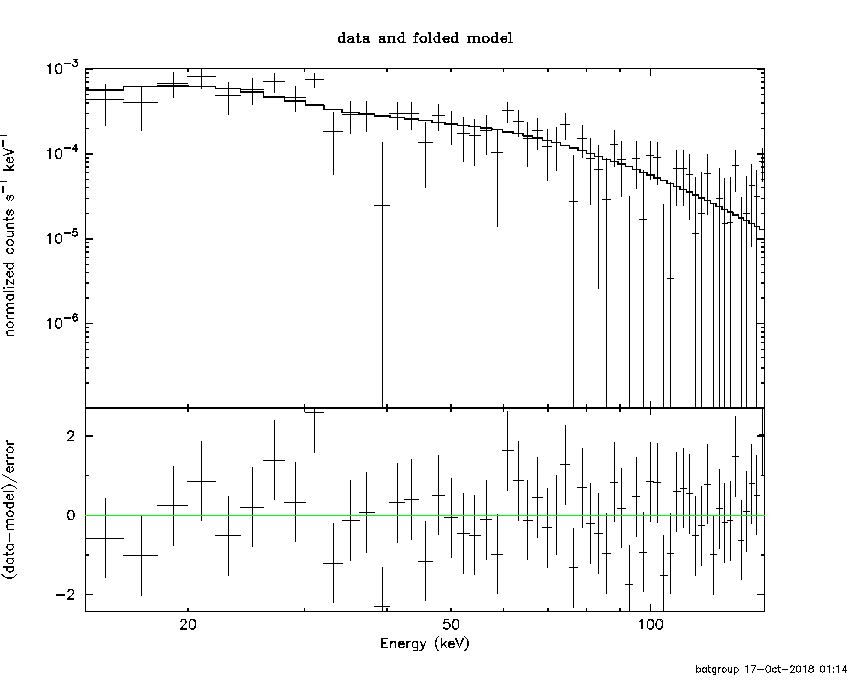
Time interval is from  -18.004 sec. to  110.136 sec.

Spectral model in power-law:
------------------------------------------------------------
Parameters  : value       lower 90%   higher 90%
Photon index: 1.50699     ( -0.203263   0.202959 )
Norm@50keV  : 1.54928E-03    ( -0.000179731   0.000178917 )
------------------------------------------------------------
#Fit statistic : Chi-Squared =          50.30 using 59 PHA bins.
# Reduced chi-squared =         0.8825 for     57 degrees of freedom
# Null hypothesis probability =   7.225725e-01

Photon flux (15-150 keV)    in 128.1 sec: 0.193776 ( -0.0228713  0.0229427 ) ph/cm2/s
Energy fluence (15-150 keV)             : 1.88058e-06 ( -2.35805e-07  2.37797e-07 ) ergs/cm2
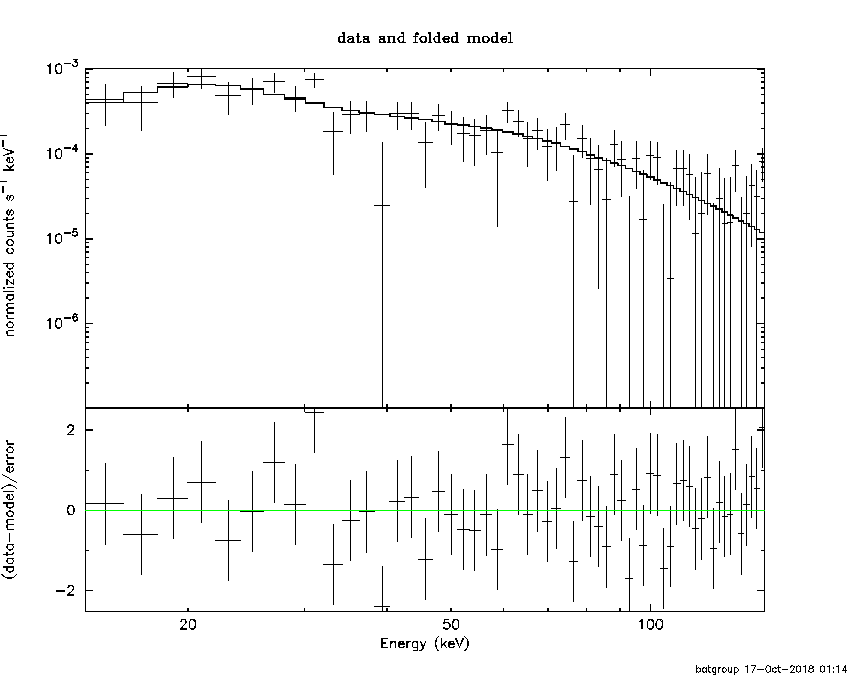
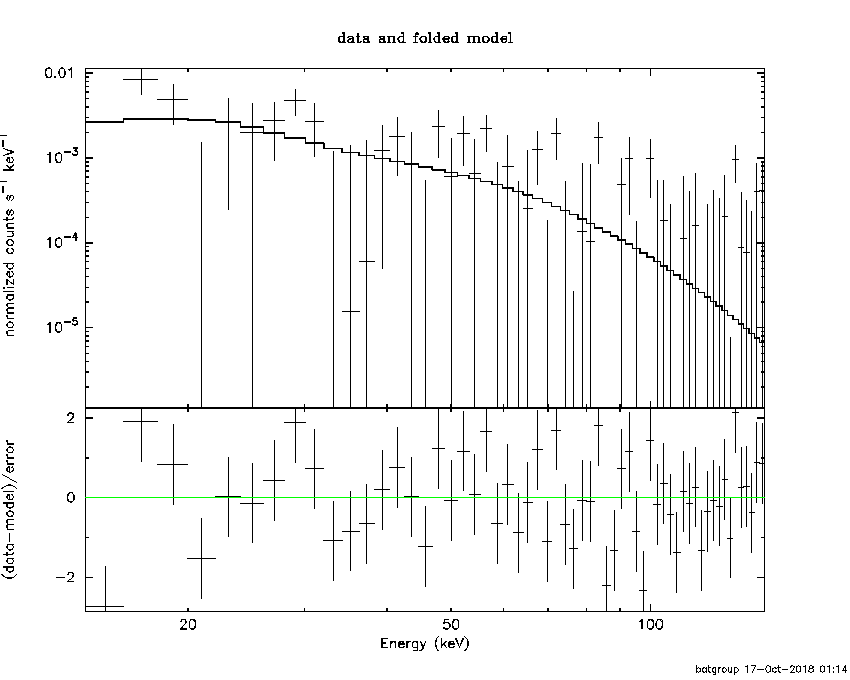
Cutoff power-law model

Time interval is from  -18.004 sec. to  110.136 sec.
Spectral model in the cutoff power-law:
------------------------------------------------------------
Parameters  : value       lower 90%   higher 90%
Photon index: 1.50855     ( -0.358246   0.201283 )
Epeak [keV] : 9999.36      ( -9999.36 -9999.36 )
Norm@50keV  : 1.55143E-03    ( -0.000909266   0.00182057 )
------------------------------------------------------------
#Fit statistic : Chi-Squared =          50.31 using 59 PHA bins.
# Reduced chi-squared =         0.8983 for     56 degrees of freedom
# Null hypothesis probability =   6.892345e-01

Photon flux (15-150 keV)    in 128.1 sec: 0.193907 ( -0.023065  0.02273 ) ph/cm2/s
Energy fluence (15-150 keV)             : 1.87974e-06 ( -2.44645e-07  2.36754e-07 ) ergs/cm2
Band function
Time interval is from  -18.004 sec. to  110.136 sec.

Spectral model in the Band function:
------------------------------------------------------------
Parameters  : value       lower 90%   higher 90%
alpha       : 4.94628   ( -4.94628   -4.94628 )
beta        : -1.59813    ( -0.292751   0.231821 )
Epeak [keV] : 24.6351      ( -24.6351 6.4853 )
Norm@50keV   : 166.707    ( -18.8752   800414 )
------------------------------------------------------------
#Fit statistic : Chi-Squared =          49.06 using 59 PHA bins.
# Reduced chi-squared =         0.8920 for     55 degrees of freedom
# Null hypothesis probability =   6.997821e-01

Photon flux (15-150 keV)    in 128.1 sec:  (    ) ph/cm2/s
Energy fluence (15-150 keV)             : 0 ( 0  0 ) ergs/cm2
Single BB
Spectral model blackbody:
------------------------------------------------------------
Parameters  : value    Lower 90%  Upper 90%
kT [keV]    : 14.9449  (-2.30581  2.83436)
R^2/D10^2   : 2.15912E-02  (-0.00984734   0.0177451)
(R is the radius in km and D10 is the distance to the source in units of 10 kpc)
------------------------------------------------------------
#Fit statistic : Chi-Squared =          75.21 using 59 PHA bins.
# Reduced chi-squared =          1.320 for     57 degrees of freedom
# Null hypothesis probability =   5.338273e-02

Energy  Fluence     90% Error
[keV]   [erg/cm2]   [erg/cm2]
15- 25  1.294e-07   2.912e-08
25- 50  5.125e-07   9.069e-08
50-150  7.777e-07   1.936e-07
15-150  1.419e-06   2.362e-07
Thermal bremsstrahlung (OTTB)
Spectral model: thermal bremsstrahlung
------------------------------------------------------------
Parameters  : value         Lower 90%    Upper 90%
kT [keV]    : 199.358       (-72.0239      -199.362)
Norm        : 0.793096       (-0.0901834     0.0903475)
------------------------------------------------------------
#Fit statistic : Chi-Squared =          51.18 using 59 PHA bins.
# Reduced chi-squared =         0.8979 for     57 degrees of freedom
# Null hypothesis probability =   6.920066e-01

Energy  Fluence     90% Error
[keV]   [erg/cm2]   [erg/cm2]
15- 25  2.530e-07   1.399e-07
25- 50  4.867e-07   2.652e-07
50-150  1.067e-06   5.874e-07
15-150  1.807e-06   9.838e-07
Double BB
Spectral model: bbodyrad<1> + bbodyrad<2>
------------------------------------------------------------
Parameters  : value         Lower 90%    Upper 90%
kT1 [keV]   : 6.94875        (-1.77306      2.62283)
R1^2/D10^2  : 0.236128        (-0.153732      0.263191)
kT2 [keV]   : 31.3102        (-9.78      48.9069)
R2^2/D10^2  : 1.37111E-03    (-0.0012475   0.00357516)
------------------------------------------------------------
#Fit statistic : Chi-Squared =          49.30 using 59 PHA bins.
# Reduced chi-squared =         0.8964 for     55 degrees of freedom
# Null hypothesis probability =   6.910820e-01

Energy  Fluence     90% Error
[keV]   [erg/cm2]   [erg/cm2]
15- 25  2.591e-07   1.296e-07
25- 50  4.789e-07   1.873e-07
50-150  1.170e-06   6.238e-07
15-150  1.908e-06   8.951e-07
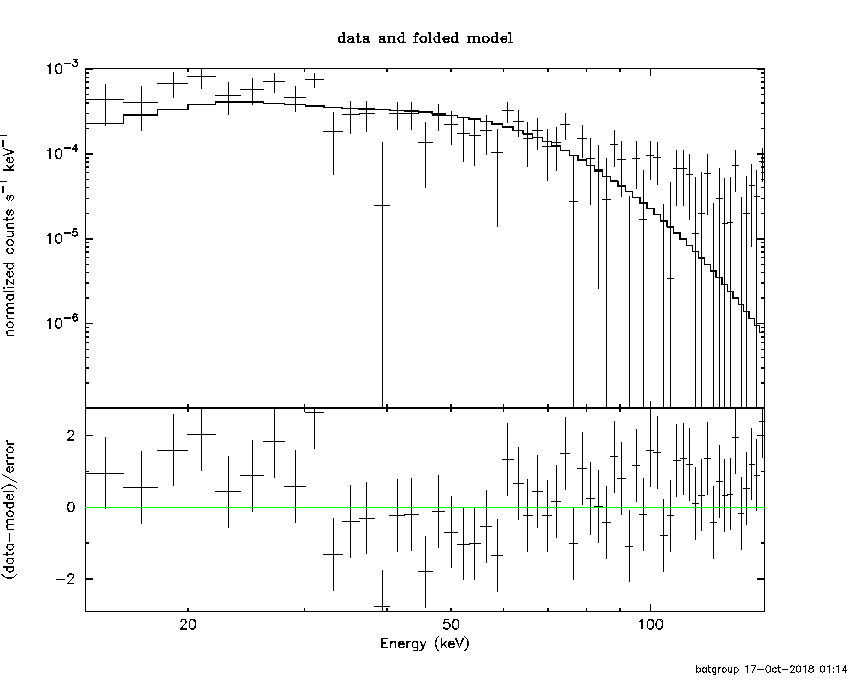
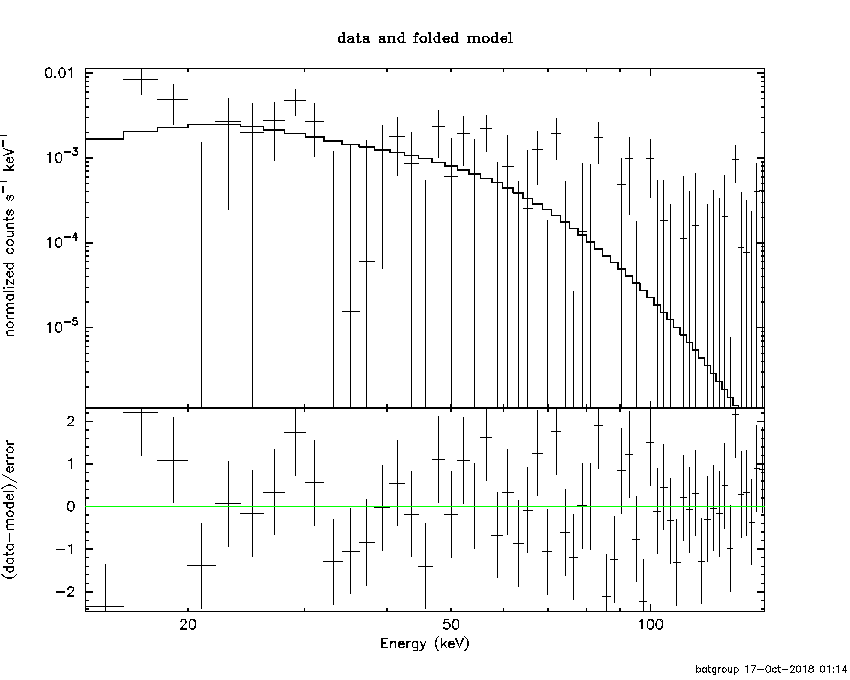
Peak spectrum fit
Power-law model

Time interval is from    0.392 sec. to    1.392 sec.

Spectral model in power-law:
------------------------------------------------------------
Parameters  : value       lower 90%   higher 90%
Photon index: 1.99061     ( -0.62947   0.726817 )
Norm@50keV  : 4.42338E-03    ( -0.00213918   0.00209854 )
------------------------------------------------------------
#Fit statistic : Chi-Squared =          70.80 using 59 PHA bins.
# Reduced chi-squared =          1.242 for     57 degrees of freedom
# Null hypothesis probability =   1.034180e-01

Photon flux (15-150 keV)    in 1 sec: 0.660815 ( -0.267874  0.26854 ) ph/cm2/s
Energy fluence (15-150 keV)             : 4.06749e-08 ( -1.81e-08  1.94443e-08 ) ergs/cm2
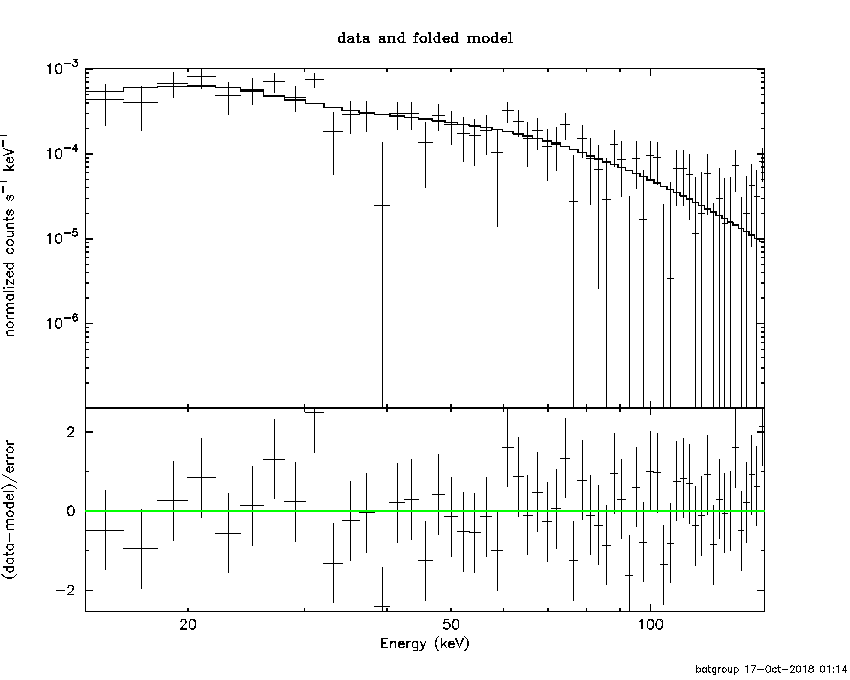
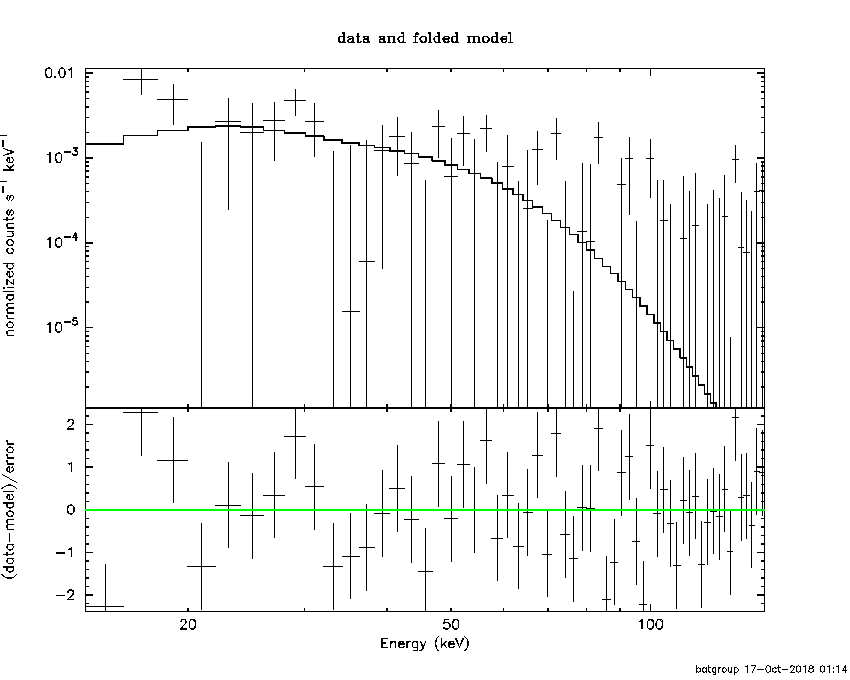
Cutoff power-law model
Time interval is from    0.392 sec. to    1.392 sec.
Spectral model in the cutoff power-law:
------------------------------------------------------------
Parameters  : value       lower 90%   higher 90%
Photon index: -0.849250     ( -5.83871   2.8937 )
Epeak [keV] : 39.9666      (   )
Norm@50keV  : 0.210706    (     )
------------------------------------------------------------
#Fit statistic : Chi-Squared =          68.01 using 59 PHA bins.
# Reduced chi-squared =          1.214 for     56 degrees of freedom
# Null hypothesis probability =   1.304540e-01

Photon flux (15-150 keV)    in 1 sec: 0.629239 ( -0.255131  0.262803 ) ph/cm2/s
Energy fluence (15-150 keV)             : 3.47784e-08 ( -1.44998e-08  1.78606e-08 ) ergs/cm2
Band function

Time interval is from    0.392 sec. to    1.392 sec.

Spectral model in the Band function:
------------------------------------------------------------
Parameters  : value       lower 90%   higher 90%
alpha       : 1.15156   ( -4.37174   -1.59245 )
beta        : -9.99659    ( 9.96079   19.9596 )
Epeak [keV] : 39.3961      ( -15.0271 68.3748 )
Norm@50keV   : 0.321354    ( -0.326797   1426.49 )
------------------------------------------------------------
#Fit statistic : Chi-Squared =          68.01 using 59 PHA bins.
# Reduced chi-squared =          1.237 for     55 degrees of freedom
# Null hypothesis probability =   1.118137e-01

Photon flux (15-150 keV)    in 1 sec:  (    ) ph/cm2/s
Energy fluence (15-150 keV)             : 0 ( 0  0 ) ergs/cm2
Single BB
Spectral model blackbody:
------------------------------------------------------------
Parameters  : value    Lower 90%  Upper 90%
kT [keV]    : 10.3184  (-3.36697  4.53646)
R^2/D10^2   : 0.304935  (-0.304935   1.07178)
(R is the radius in km and D10 is the distance to the source in units of 10 kpc)
------------------------------------------------------------
#Fit statistic : Chi-Squared =          68.06 using 59 PHA bins.
# Reduced chi-squared =          1.194 for     57 degrees of freedom
# Null hypothesis probability =   1.497615e-01

Energy  Fluence     90% Error
[keV]   [erg/cm2]   [erg/cm2]
15- 25  6.678e-09   4.134e-09
25- 50  1.735e-08   1.093e-08
50-150  9.905e-09   7.895e-09
15-150  3.393e-08   2.164e-08
Thermal bremsstrahlung (OTTB)
Spectral model: thermal bremsstrahlung
------------------------------------------------------------
Parameters  : value         Lower 90%    Upper 90%
kT [keV]    : 56.8631       (-32.9877      -57.0595)
Norm        : 3.70277       (-1.77963     3.19474)
------------------------------------------------------------
#Fit statistic : Chi-Squared =          69.46 using 59 PHA bins.
# Reduced chi-squared =          1.219 for     57 degrees of freedom
# Null hypothesis probability =   1.245725e-01

Energy  Fluence     90% Error
[keV]   [erg/cm2]   [erg/cm2]
15- 25  9.220e-09   6.030e-09
25- 50  1.380e-08   8.675e-09
50-150  1.500e-08   1.317e-08
15-150  3.802e-08   2.644e-08
Double BB
------------------------------------------------------------
Parameters  : value         Lower 90%    Upper 90%
kT1 [keV]   : 5.49353        (-5.74313      189.381)
R1^2/D10^2  : 0.706920        (-0.733566      -0.733566)
kT2 [keV]   : 11.6037        (-11.5741      -11.5741)
R2^2/D10^2  : 0.166010    (-0.163099   1.1574)
------------------------------------------------------------
#Fit statistic : Chi-Squared =          68.06 using 59 PHA bins.
#Fit statistic : Chi-Squared =          67.95 using 59 PHA bins.
# Reduced chi-squared =          1.238 for     55 degrees of freedom
# Reduced chi-squared =          1.235 for     55 degrees of freedom
# Null hypothesis probability =   1.110037e-01
# Null hypothesis probability =   1.128433e-01

Energy  Fluence     90% Error
[keV]   [erg/cm2]   [erg/cm2]
15- 25  0.000e+00   0.000e+00
25- 50  0.000e+00   0.000e+00
50-150  0.000e+00   0.000e+00
15-150  0.000e+00   0.000e+00
Plot creation:
Wed Oct 17 01:15:18 EDT 2018