batgrbproduct Analysis for Trigger=599037
Analysis Summary
Notes:
- 1) No attempt has been made to eliminate the non-significant decimal places.
- 2) This batgrbproduct analysis is done of the amount of data for this trigger downloaded to date.
- 3) This batgrbproduct analysis is using the flight position for the mask-weighting calculation.
- 4) This page will be updated for up to 10 downlinks after the trigger.
======================================================================
BAT GRB EVENT DATA PROCESSING REPORT
Process Script Ver: batgrbproduct v2.46
Process Start Time (local time): Fri May 16 12:43:52 EDT 2014
Host Name: bat1
Current Working Dir: /local/data/bat1/prebascript/trigger599037/batgroup_hand_proc
======================================================================
Trigger: 00599037 Segment: 000
BAT Trigger Time: 421837968.704 [s; MET]
Trigger Stop: 421837969.728 [s; MET]
UTC: 2014-05-15T09:12:36.691200 [includes UTCF correction]
Where From?: TDRSS position message
BAT
RA: 186.03622967468 Dec: 15.0772932428 [deg; J2000]
Catalogged Source?: NO
Point Source?: YES
GRB Indicated?: YES [ by BAT flight software ]
Image S/N Ratio: 8.23
Image Trigger?: NO
Rate S/N Ratio: 13.8924439894498 [ if not an image trigger ]
Image S/N Ratio: 8.23
Flight Position: [ source = BAT ]
RA: 186.03622967468 Dec: 15.0772932428 [deg; J2000]
Ground Position: [ source = BAT pre-slew burst ]
RA: 186.0706701324 Dec: 15.0988357566227 [deg; J2000]
{ 12h 24m 17.0s , +15d 05' 55.8" }
+/- 1.24247628938257 [arcmin] (estimated 90% radius based on SNR)
+/- 0.443549570171763 [arcmin] (formal 1-sigma fit error)
SNR: 22.3059682877933
Angular difference between Flight and Ground position is 2.377283 arcmin
Partial Coding Fraction: 0.9921875 [ including projection effects ]
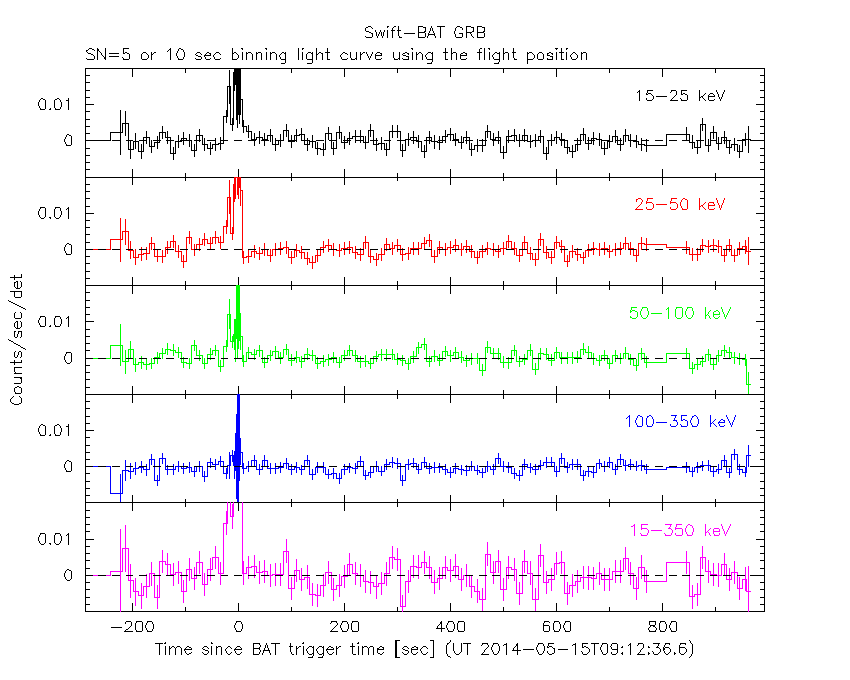
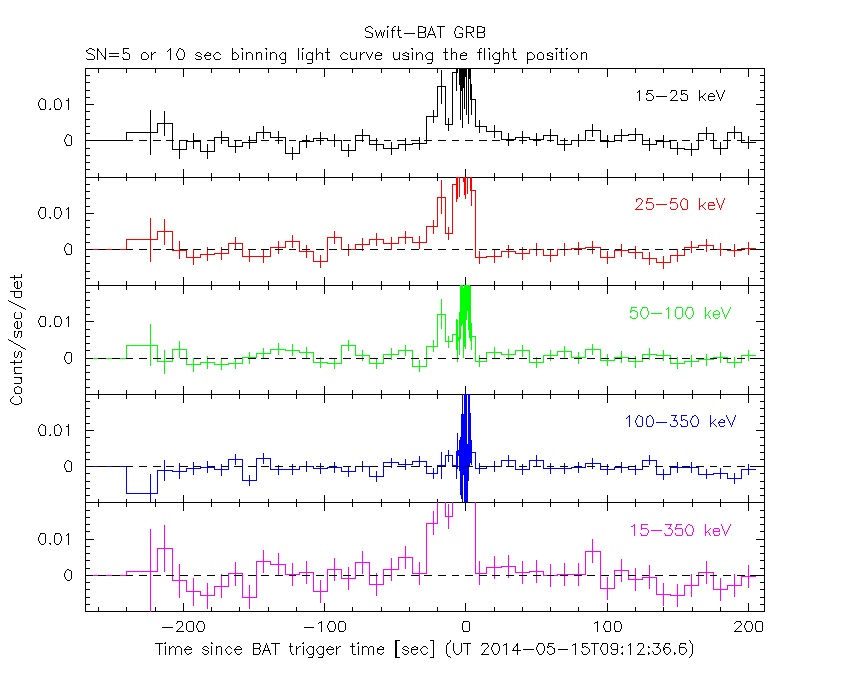
Duration
T90: 23.4279999136925 +/- 2.07389877414418
Measured from: -20.6119999885559
to: 2.81599992513657 [s; relative to TRIGTIME]
T50: 9.51999998092651 +/- 5.42492321055056
Measured from: -9.1240000128746
to: 0.39599996805191 [s; relative to TRIGTIME]
Fluence
Peak Flux (peak 1 second)
Measured from: 1.50800001621246
to: 2.50800001621246 [s; relative to TRIGTIME]
Total Fluence
Measured from: -22.027999997139
to: 3.76399999856949 [s; relative to TRIGTIME]
Band 1 Band 2 Band 3 Band 4
15-25 25-50 50-100 100-350 keV
Total 0.403022 0.496389 0.251327 0.068234
0.028017 0.028000 0.024496 0.021869 [error]
Peak 0.040237 0.050739 0.023296 0.008899
0.005907 0.005919 0.005042 0.004334 [error]
[ fluence units of on-axis counts / fully illuminated detector ]
======================================================================
=== Fluence/Peak Flux Summary ===
Model Band1 Band2 Band3 Band4 Band5 Total
15-25 25-50 50-100 100-350 15-150 15-350 keV
Fluence Power-law 1.24e-07 1.84e-07 2.04e-07 4.26e-07 6.41e-07 9.38e-07 erg/cm2
Error 1.32e-08 1.29e-08 2.33e-08 9.87e-08 5.35e-08 1.22e-07 erg/cm2
Peak flux Power-law 3.65e-01 3.14e-01 1.84e-01 1.62e-01 9.33e-01 1.02e+00 ph/cm2/s
Error 7.50e-02 4.50e-02 3.97e-02 6.61e-02 1.34e-01 1.51e-01 ph/cm2/s
Fluence Cutoff-PL 1.12e-07 2.02e-07 2.00e-07 1.18e-07 5.88e-07 6.32e-07 erg/cm2
Error 1.56e-08 1.77e-08 2.68e-08 6.15e-08 1.23e-07 0.00e+00 erg/cm2
Peak flux Cutoff-PL 3.26e-01 3.70e-01 1.74e-01 2.91e-02 8.95e-01 9.00e-01 ph/cm2/s
Error 8.54e-02 6.68e-02 5.22e-02 6.05e-02 1.36e-01 1.43e-01 ph/cm2/s
Fluence Band 0.00e+00 0.00e+00 0.00e+00 0.00e+00 0.00e+00 0.00e+00 erg/cm2
Error 0.00e+00 0.00e+00 0.00e+00 0.00e+00 0.00e+00 0.00e+00 erg/cm2
Peak flux Band 0.00e+00 0.00e+00 0.00e+00 0.00e+00 0.00e+00 0.00e+00 ph/cm2/s
Error 0.00e+00 0.00e+00 0.00e+00 0.00e+00 0.00e+00 0.00e+00 ph/cm2/s
=== Time-averaged spectral analysis ===

Model Ph_index Ph_90err Epeak  Epeak_90err Norm     Nomr_90err chi2   dof
PL    1.851    0.132    -      -           2.70e-03 2.24e-04   61.030 57
CPL   0.982    0.639      51.3   14.7      8.18e-03 7.82e-03   54.370 56

The chi2 of BB fit is Chi-Squared Chi-Squared which shows a significant improvement in the fit over a PL.
Check the BB fit.

=== 1-s peak spectral analysis ===

Model Ph_index Ph_90err Epeak  Epeak_90err Norm     Nomr_90err chi2   dof
PL    1.769    0.244    -      -           6.85e-03 1.14e-03   71.770 57
CPL   0.349    1.413      47.1   26.9      4.71e-02 2.14e-01   67.700 56

Model      : spectral model: simple power-law (PL) and cutoff power-law (CPL)
Ph_index   : photon index: E^-{Ph_index} (minus sign is not included in the index)
Ph_90err   : 90% error of the photon index
Epeak      : Epeak in keV
Epeak_90err: 90% error of Epeak
Norm       : normalization at 50 keV in PL model and at 1 keV in CPL model
Nomr_90err : 90% error of the normalization
chi2       : Chi-Squared
dof        : degree of freedom
=== T90/T50 calculation in the 50-300 keV band (BATSE band) using 64 ms lc ===

T90 in the 50-300 keV band: 24.384000 sec.
T50 in the 50-300 keV band: 11.072000 sec.
=== Table of the duration information ==

        Value   tstart    tstop
T100   25.792  -22.028    3.764
T90    23.428  -20.612    2.816
T50     9.520   -9.124    0.396
Peak    1.000    1.508    2.508
Image
Pre-slew 15.0-350.0 keV image (Event data)
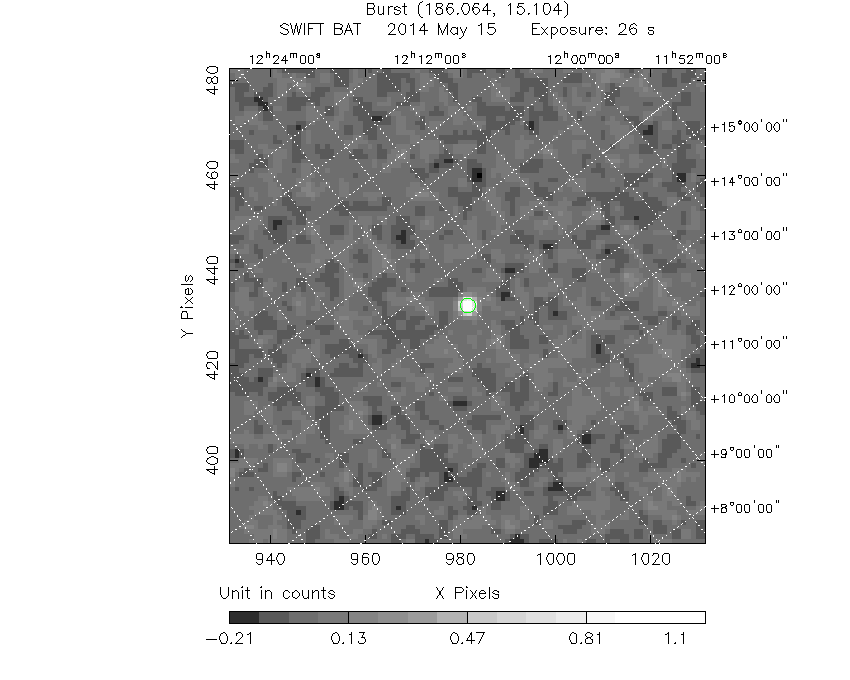
#   RAcent    DECcent   POSerr    Theta     Phi              Peak Cts       SNR   Name
  186.0707    15.0988   0.0087    13.1348   156.6457         1.2451230     22.306 TRIG_00599037

Foreground time interval of the image:
-22.028   3.764 (delta_t =  25.792 [sec])
Background time interval of the image:
-155.403 -22.028 (delta_t = 133.375 [sec])
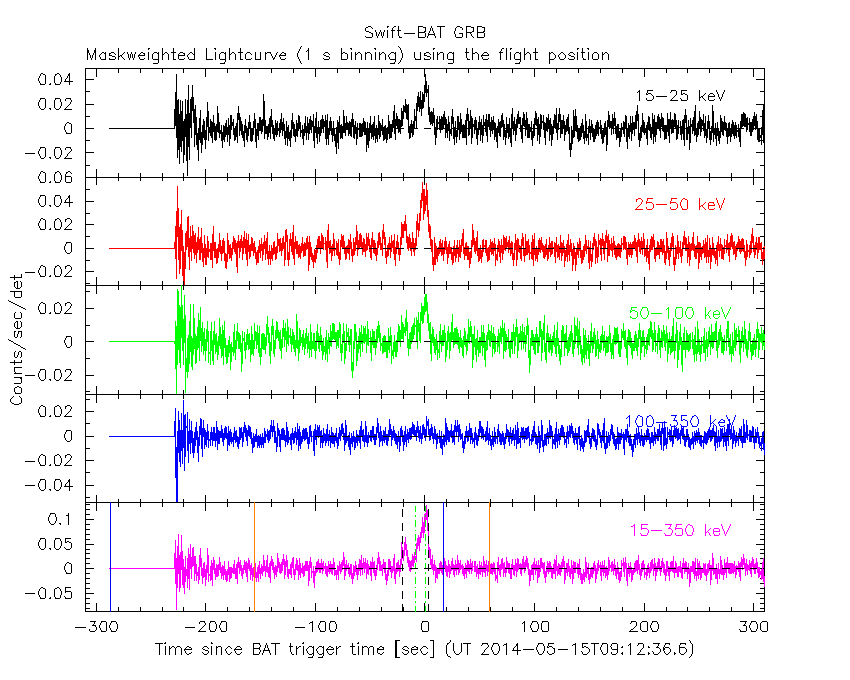
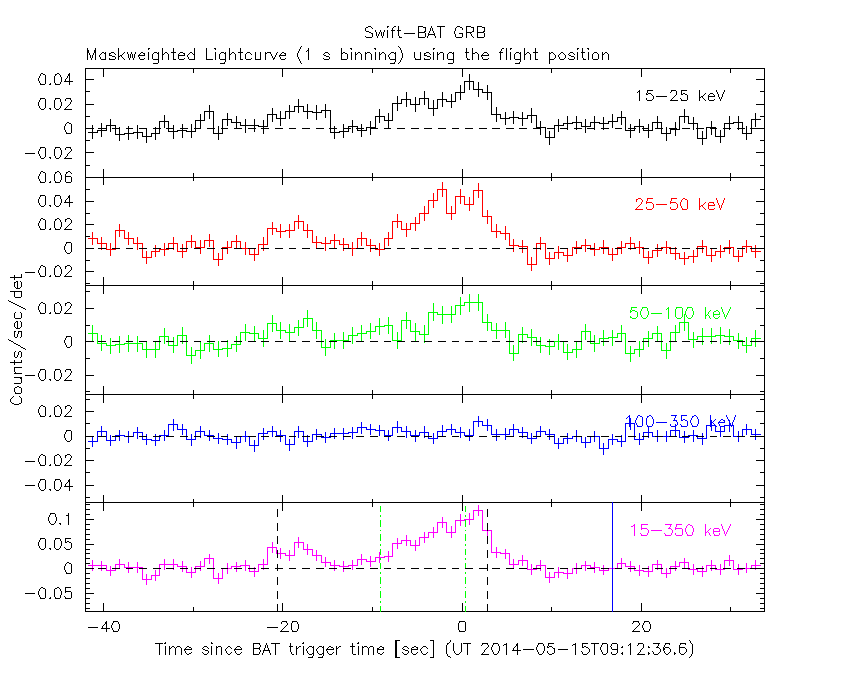
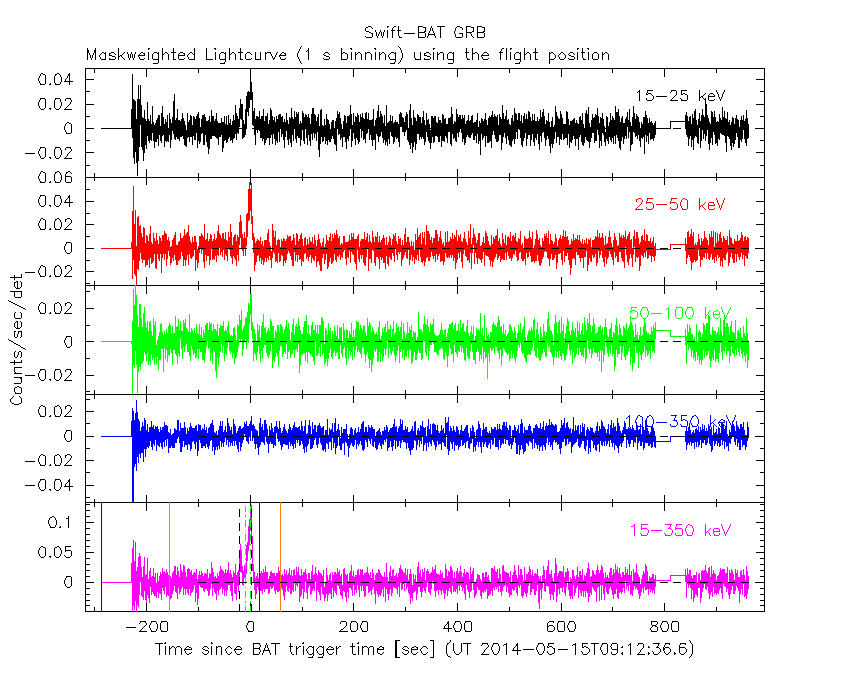
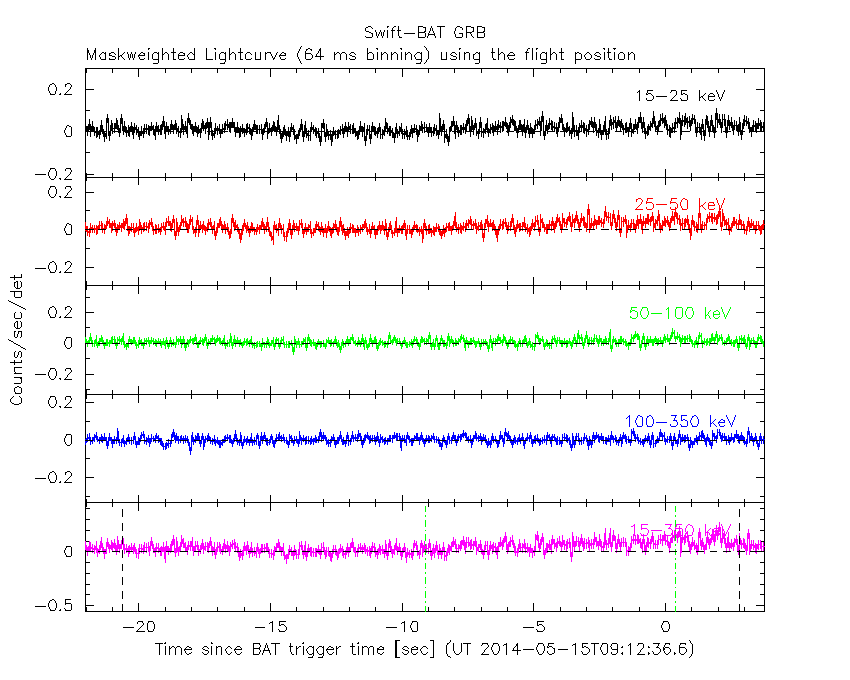
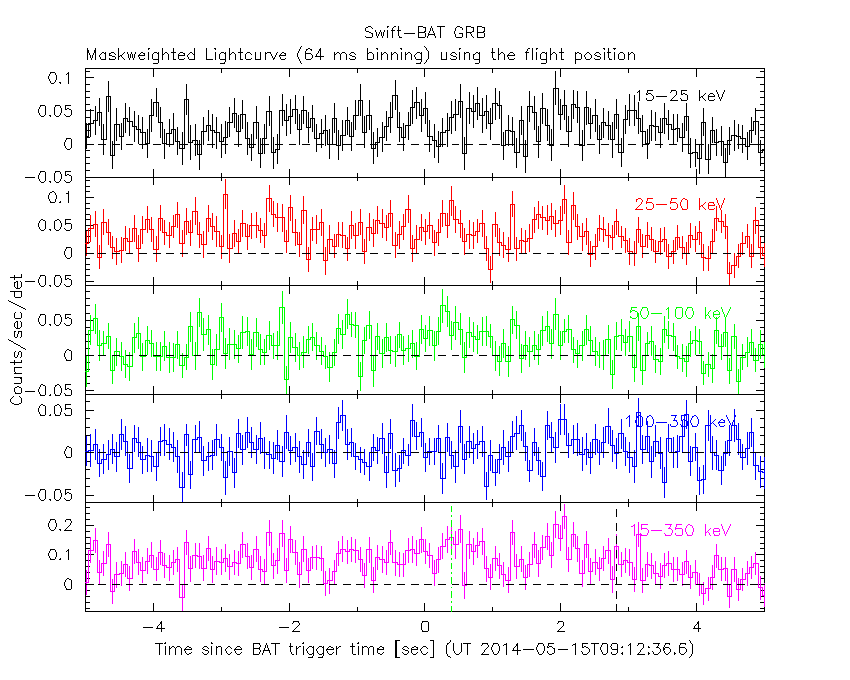
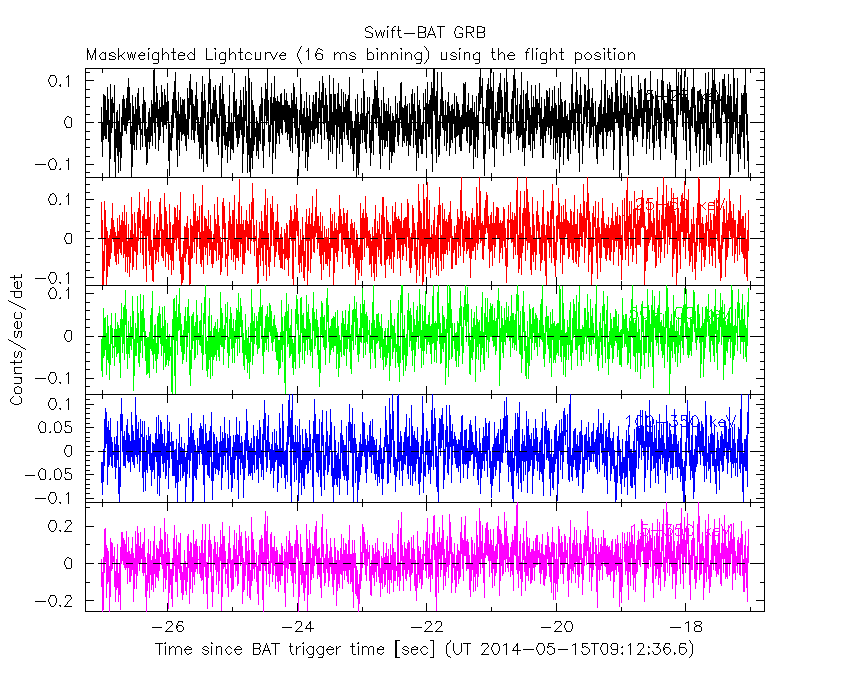
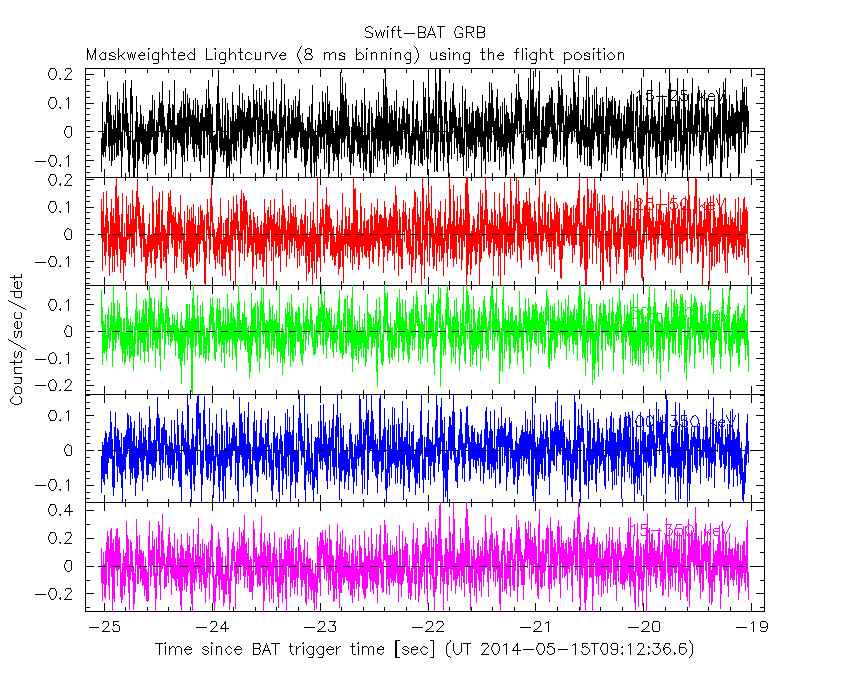
Lightcurves
Notes:
- 1) All plots contain as much data as has been downloaded to date.
- 2) The mask-weighted light curves are using the flight position.
- 3) Multiple plots of different time binning/intervals are shown to cover all scenarios of short/long GRBs, rate/image triggers, and real/false positives.
- 4) For all the mask-weighted lightcurves, the y-axis units are counts/sec/det where a det is 0.4 x 0.4 = 0.16 sq cm.
- 5) The verticle lines correspond to following: green dotted lines are T50 interval, black dotted lines are T90 interval, blue solid line(s) is a spacecraft slew start time, and orange solid line(s) is a spacecraft slew end time.
- 6) Time of each bin is in the middle of the bin.
1 s binning
From T0-310 s to T0+310 s
From T100_start - 20 s to T100_end + 30 s
Full time interval
64 ms binning
Full time interval

From T100_start to T100_end
From T0-5 sec to T0+5 sec
16 ms binning
From T100_start-5 s to T100_start+5 s
8 ms binning
From T100_start-3 s to T100_start+3 s
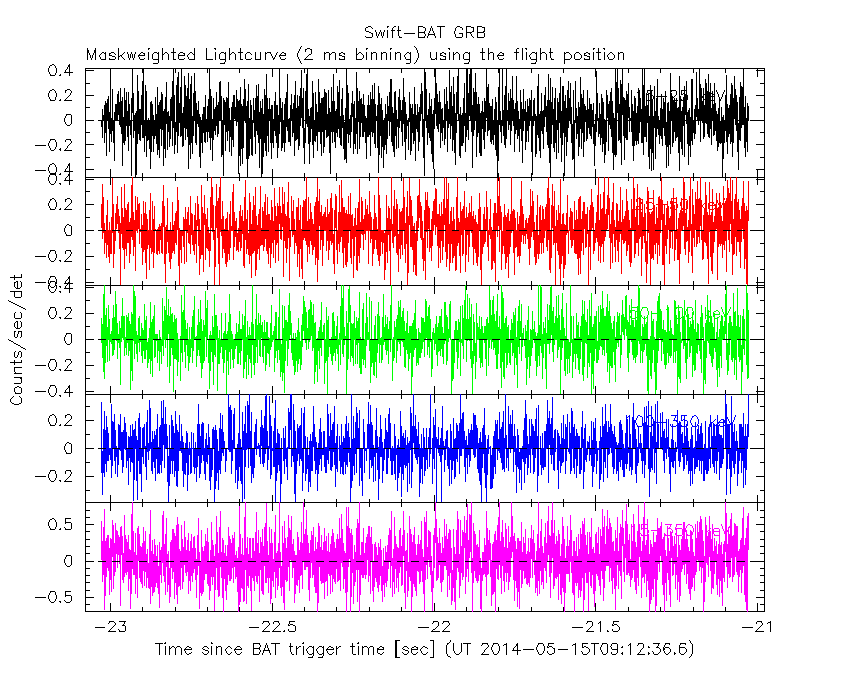
2 ms binning
From T100_start-1 s to T100_start+1 s
SN=5 or 10 sec. binning (whichever binning is satisfied first)
SN=5 or 10 sec. binning (T < 200 sec)
Spectra
Notes:
- 1) The fitting includes the systematic errors.
- 2) For long bursts, a spectral fit of the pre-slew DRM will introduce some errors in both a spectral shape and a normalization if the PHA file contains a lot of the slew/post-slew time interval.
- 3) For fits to more complicated models (e.g. a power-law over a cutoff power-law), the BAT team has decided to require a chi-square improvement of more than 6 for each extra dof.
- 4) For short bursts (T90<1sec), the specrtum is also fit with Blackbody, OTTB, and Double Blackbody.
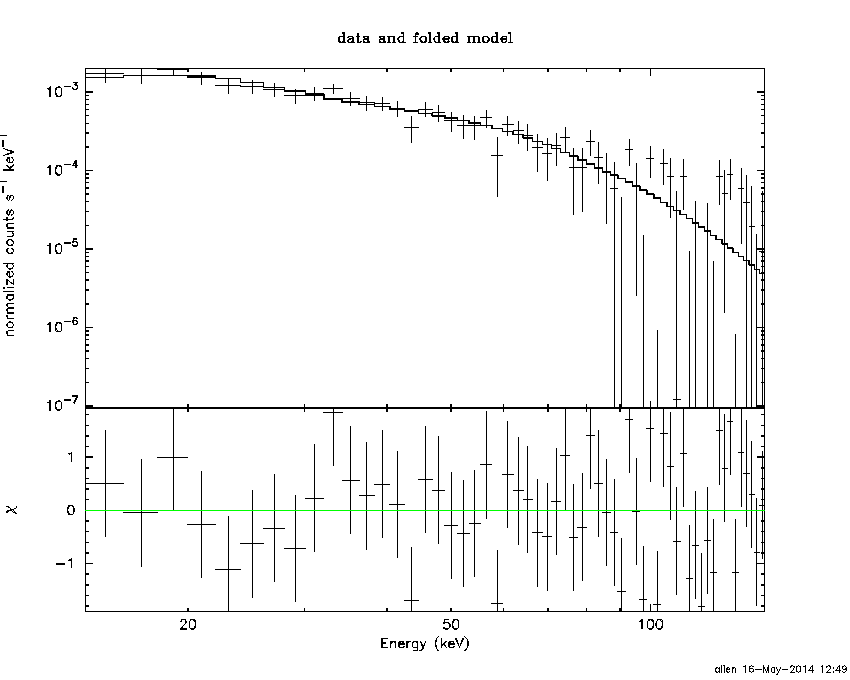
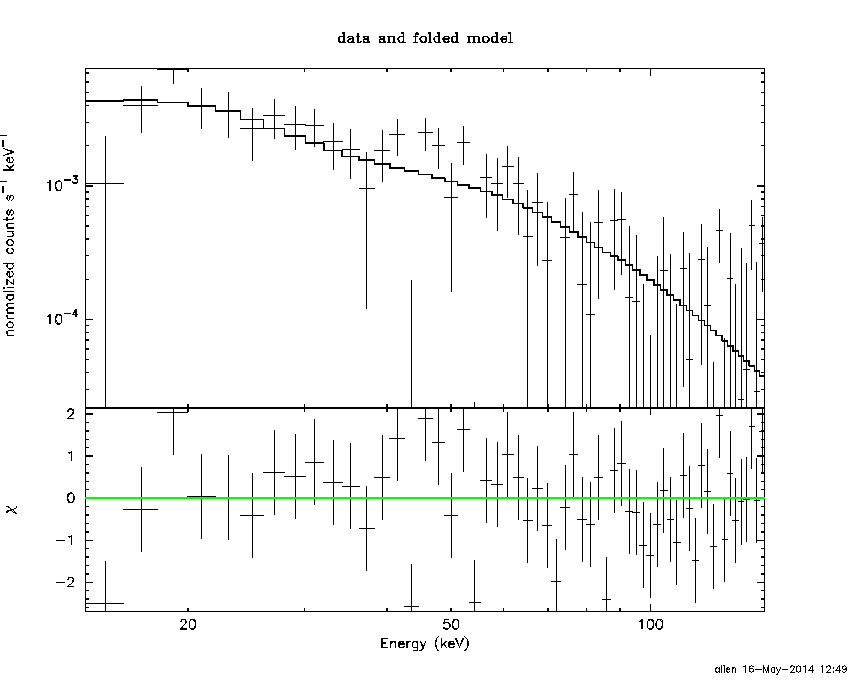
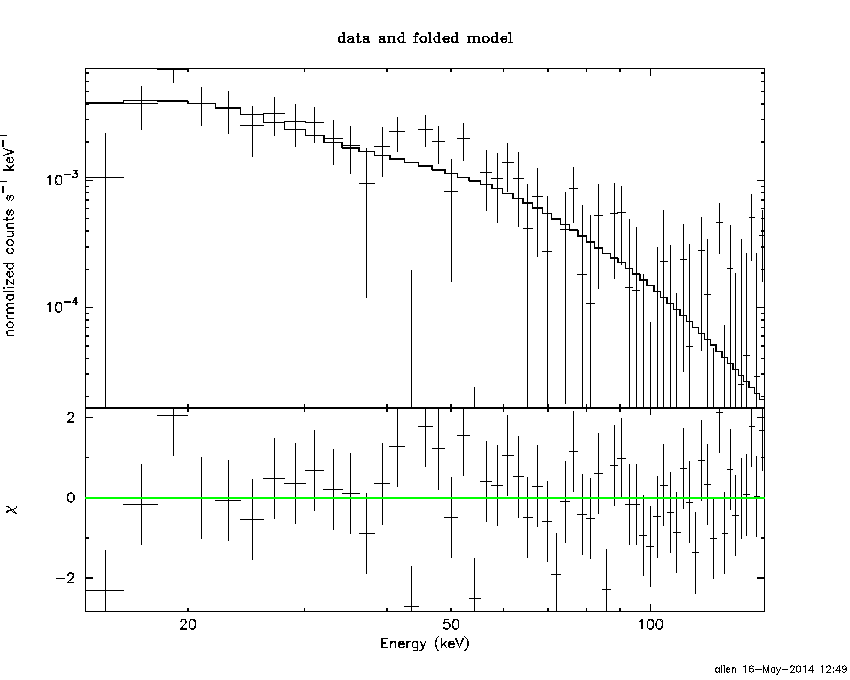
Time averaged spectrum fit using the pre-slew DRM
Power-law model
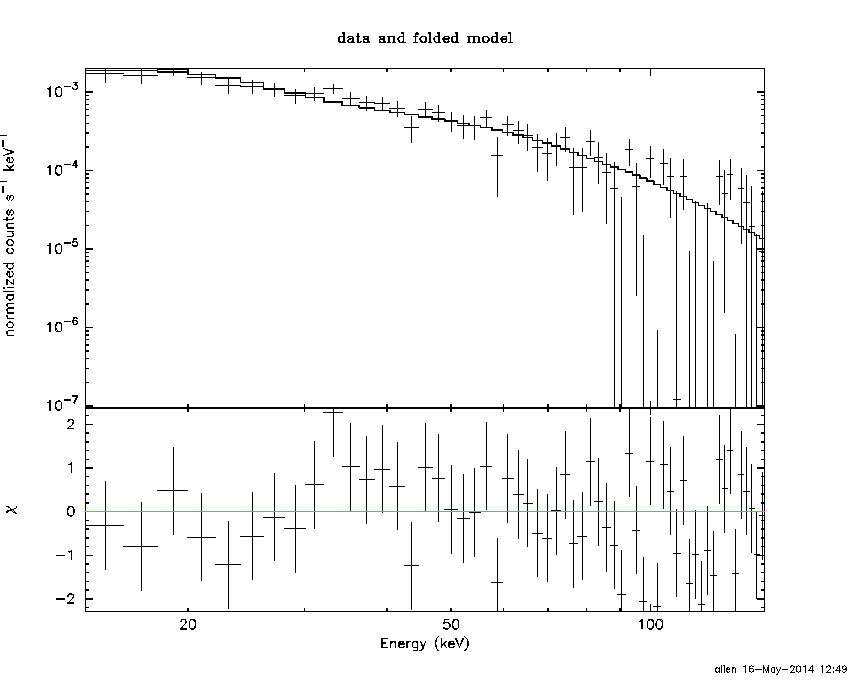
Time interval is from  -22.028 sec. to    3.764 sec.

Spectral model in power-law:
------------------------------------------------------------
Parameters  : value       lower 90%   higher 90%
Photon index: 1.85127     ( -0.130001   0.133853 )
Norm@50keV  : 2.70367E-03    ( -0.000224968   0.000222053 )
------------------------------------------------------------
#Fit statistic : Chi-Squared =          61.03 using 59 PHA bins.
# Reduced chi-squared =          1.071 for     57 degrees of freedom
# Null hypothesis probability =   3.331759e-01

Photon flux (15-150 keV)    in 25.79 sec: 0.380225 ( -0.0269337  0.0269504 ) ph/cm2/s
Energy fluence (15-150 keV)             : 6.41121e-07 ( -5.31707e-08  5.39228e-08 ) ergs/cm2
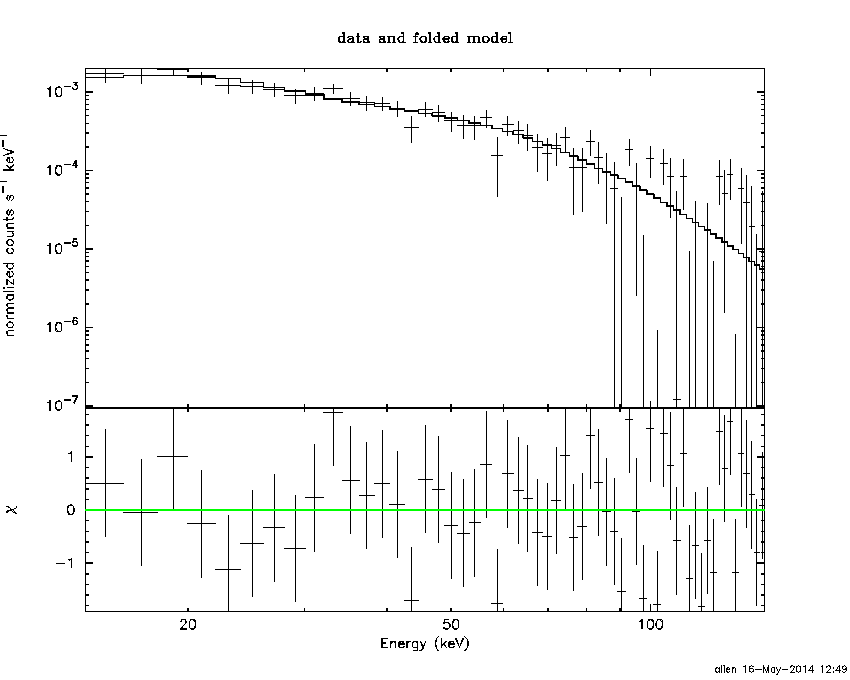
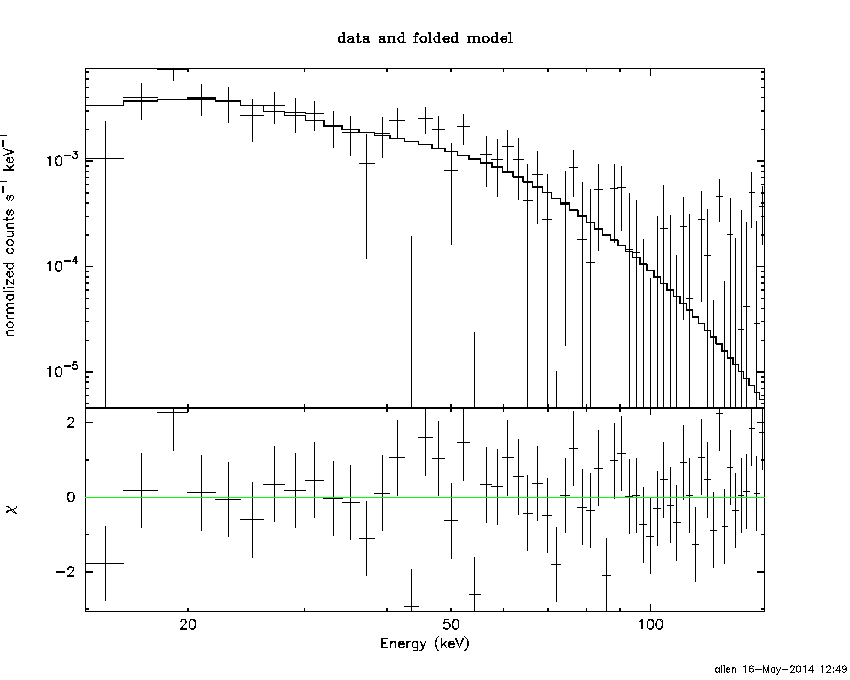
Cutoff power-law model
Time interval is from  -22.028 sec. to    3.764 sec.
Spectral model in the cutoff power-law:
------------------------------------------------------------
Parameters  : value       lower 90%   higher 90%
Photon index: 0.982121     ( -0.686936   0.591605 )
Epeak [keV] : 51.2783      ( -8.41348 21.0333 )
Norm@50keV  : 8.17912E-03    ( -0.00427248   0.0113617 )
------------------------------------------------------------
#Fit statistic : Chi-Squared =          54.37 using 59 PHA bins.
# Reduced chi-squared =         0.9709 for     56 degrees of freedom
# Null hypothesis probability =   5.367511e-01

Photon flux (15-150 keV)    in 25.79 sec: 0.364359 ( -0.028749  0.02882 ) ph/cm2/s
Energy fluence (15-150 keV)             : 5.88105e-07 ( -6.00959e-08  6.29224e-08 ) ergs/cm2
Band function
Time interval is from  -22.028 sec. to    3.764 sec.

Spectral model in the Band function:
------------------------------------------------------------
Parameters  : value       lower 90%   higher 90%
alpha       : -0.972255   ( -0.59468   1.51351 )
beta        : -3.21624    ( 3.20635   1.22868 )
Epeak [keV] : 51.0586      ( -16.0295 20.9139 )
Norm@50keV   : 8.29342E-03    ( -0.00432773   0.0752546 )
------------------------------------------------------------
#Fit statistic : Chi-Squared =          54.34 using 59 PHA bins.
# Reduced chi-squared =         0.9881 for     55 degrees of freedom
# Null hypothesis probability =   4.996137e-01

Photon flux (15-150 keV)    in 25.79 sec:  (    ) ph/cm2/s
Energy fluence (15-150 keV)             : 0 ( 0  0 ) ergs/cm2
Single BB
Spectral model blackbody:
------------------------------------------------------------
Parameters  : value    Lower 90%  Upper 90%
kT [keV]    : 11.2907  (-0.897288  0.979819)
R^2/D10^2   : 0.113362  (-0.0304049   0.0412533)
(R is the radius in km and D10 is the distance to the source in units of 10 kpc)
------------------------------------------------------------
#Fit statistic : Chi-Squared =          79.29 using 59 PHA bins.
# Reduced chi-squared =          1.391 for     57 degrees of freedom
# Null hypothesis probability =   2.709794e-02

Energy  Fluence     90% Error
[keV]   [erg/cm2]   [erg/cm2]
15- 25  7.824e-08   1.057e-08
25- 50  2.287e-07   1.836e-08
50-150  1.679e-07   2.954e-08
15-150  4.749e-07   4.423e-08
Thermal bremsstrahlung (OTTB)

Spectral model: thermal bremsstrahlung
------------------------------------------------------------
Parameters  : value         Lower 90%    Upper 90%
kT [keV]    : 86.2820       (-18.9494      28.8087)
Norm        : 1.74270       (-0.177247     0.204735)
------------------------------------------------------------
#Fit statistic : Chi-Squared =          55.12 using 59 PHA bins.
# Reduced chi-squared =         0.9670 for     57 degrees of freedom
# Null hypothesis probability =   5.459928e-01

Energy  Fluence     90% Error
[keV]   [erg/cm2]   [erg/cm2]
15- 25  1.171e-07   1.305e-08
25- 50  1.962e-07   1.462e-08
50-150  2.910e-07   1.078e-07
15-150  6.043e-07   1.046e-07
Double BB
Spectral model: bbodyrad<1> + bbodyrad<2>
------------------------------------------------------------
Parameters  : value         Lower 90%    Upper 90%
kT1 [keV]   : 5.87830        (-2.71196      2.42754)
R1^2/D10^2  : 0.713105        (-0.451359      8.07134)
kT2 [keV]   : 17.0564        (-4.06138      9.17537)
R2^2/D10^2  : 1.80359E-02    (-0.0150056   0.0420434)
------------------------------------------------------------
#Fit statistic : Chi-Squared =          56.42 using 59 PHA bins.
# Reduced chi-squared =          1.026 for     55 degrees of freedom
# Null hypothesis probability =   4.215071e-01

Energy  Fluence     90% Error
[keV]   [erg/cm2]   [erg/cm2]
15- 25  1.095e-07   4.729e-08
25- 50  2.003e-07   6.748e-08
50-150  2.606e-07   1.344e-07
15-150  5.703e-07   2.379e-07
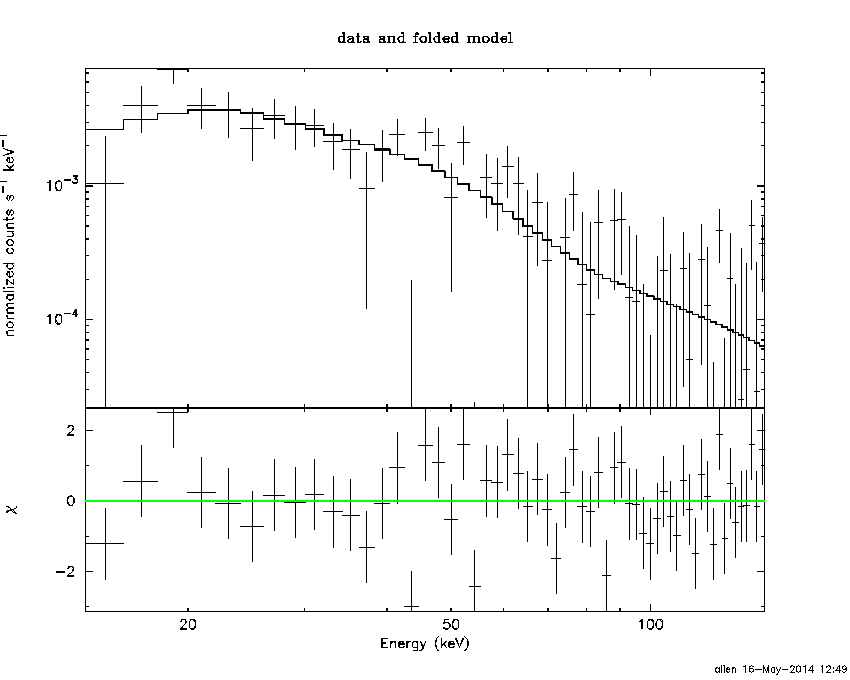
Peak spectrum fit
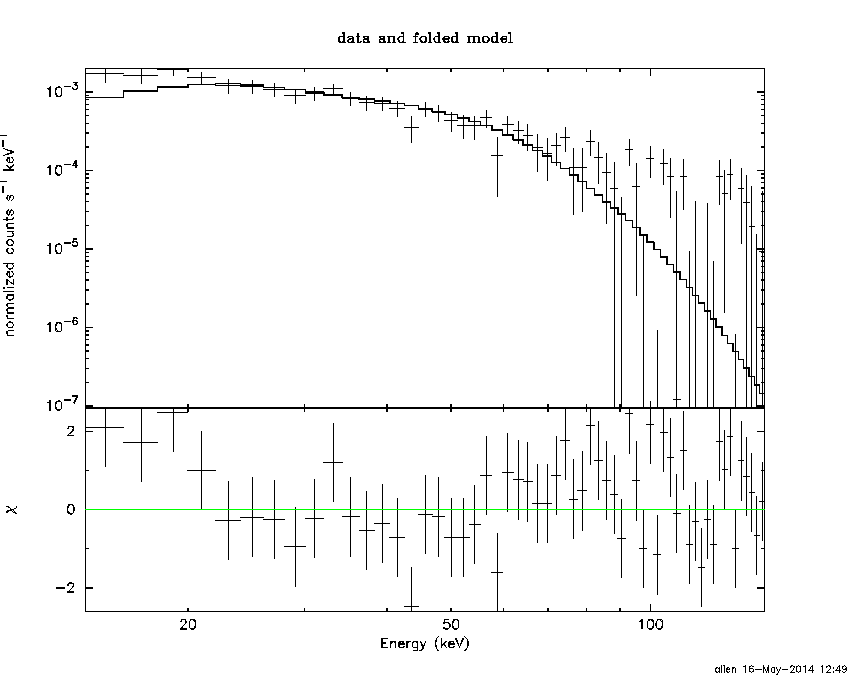
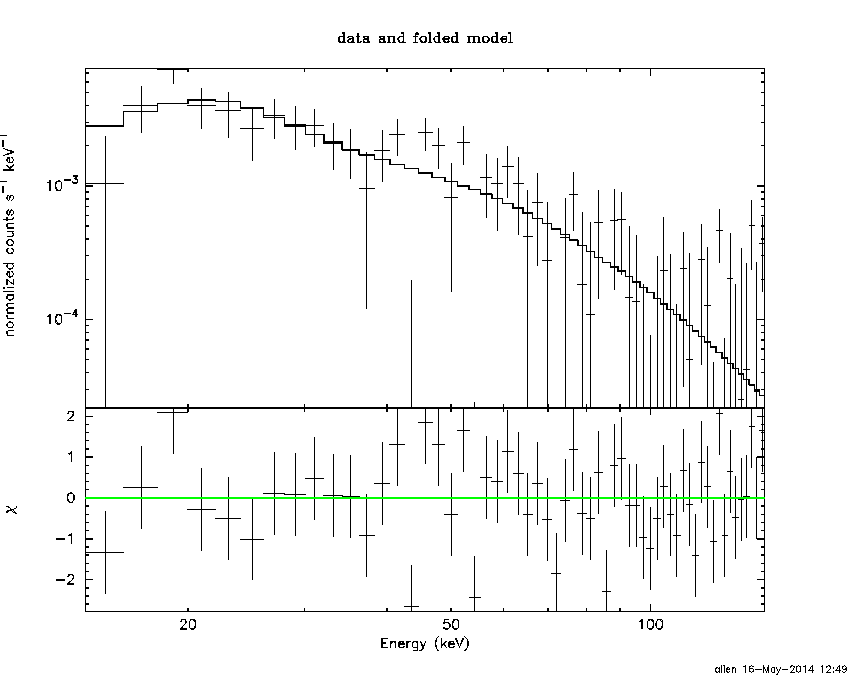
Power-law model
Time interval is from    1.508 sec. to    2.508 sec.

Spectral model in power-law:
------------------------------------------------------------
Parameters  : value       lower 90%   higher 90%
Photon index: 1.76860     ( -0.238325   0.249138 )
Norm@50keV  : 6.85338E-03    ( -0.00115604   0.00113287 )
------------------------------------------------------------
#Fit statistic : Chi-Squared =          71.77 using 59 PHA bins.
# Reduced chi-squared =          1.259 for     57 degrees of freedom
# Null hypothesis probability =   8.999765e-02

Photon flux (15-150 keV)    in 1 sec: 0.933127 ( -0.133821  0.133834 ) ph/cm2/s
Energy fluence (15-150 keV)             : 6.31786e-08 ( -1.07762e-08  1.10751e-08 ) ergs/cm2
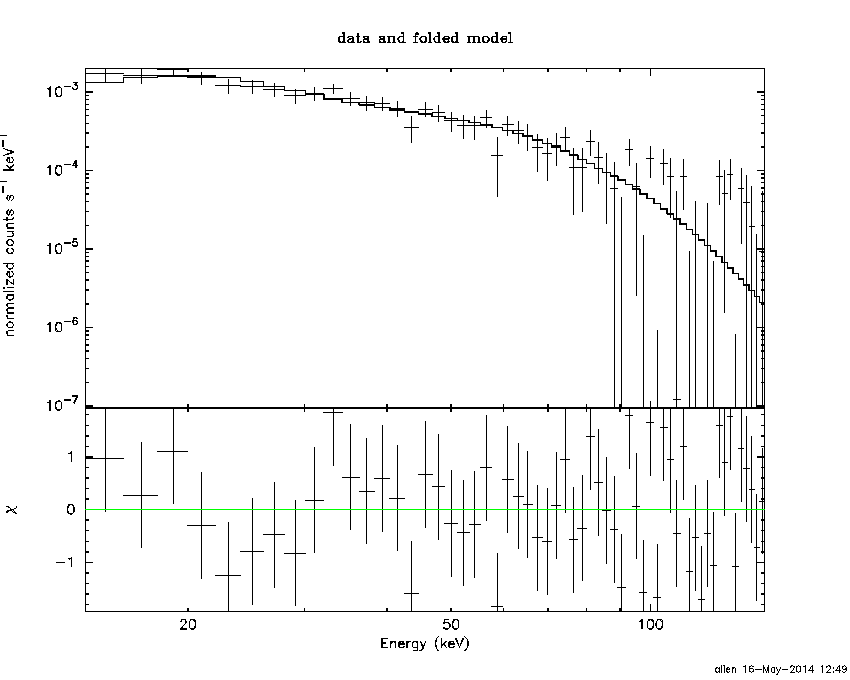
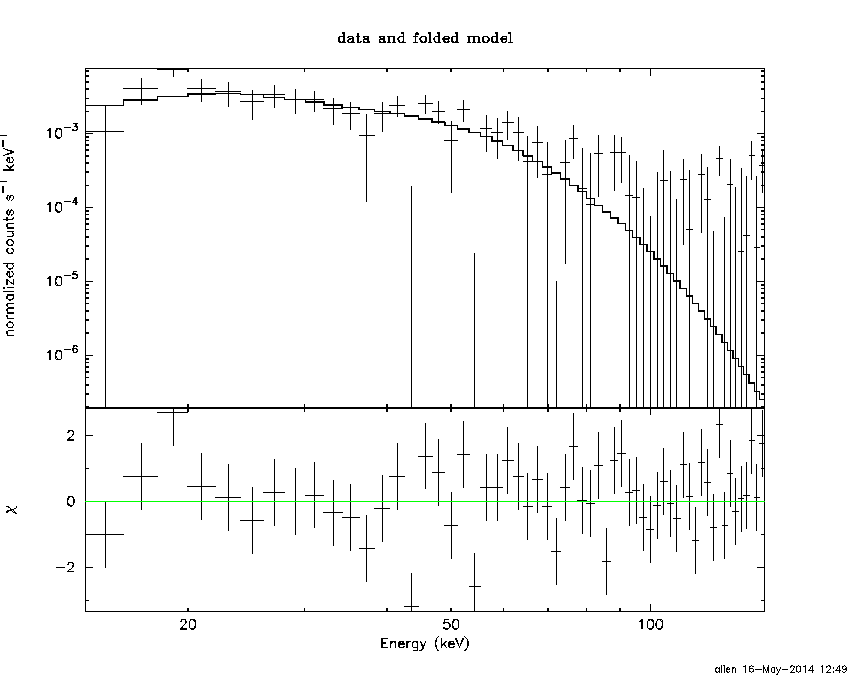
Cutoff power-law model
Time interval is from    1.508 sec. to    2.508 sec.
Spectral model in the cutoff power-law:
------------------------------------------------------------
Parameters  : value       lower 90%   higher 90%
Photon index: 0.349109     ( -1.61054   1.21466 )
Epeak [keV] : 47.0542      ( -9.95146 43.8811 )
Norm@50keV  : 4.71064E-02    ( -0.0471157   0.380916 )
------------------------------------------------------------
#Fit statistic : Chi-Squared =          67.70 using 59 PHA bins.
# Reduced chi-squared =          1.209 for     56 degrees of freedom
# Null hypothesis probability =   1.359549e-01

Photon flux (15-150 keV)    in 1 sec: 0.895410 ( -0.135736  0.13679 ) ph/cm2/s
Energy fluence (15-150 keV)             : 5.45128e-08 ( -1.0857e-08  1.27216e-08 ) ergs/cm2
Band function
Time interval is from    1.508 sec. to    2.508 sec.

Spectral model in the Band function:
------------------------------------------------------------
Parameters  : value       lower 90%   higher 90%
alpha       : 4.92657   ( -7.91931   -4.92657 )
beta        : -2.07351    ( -0.564315   0.332417 )
Epeak [keV] : 25.9894      ( -6.29778 5.53955 )
Norm@50keV   : 691.934    ( -97.2016   3860.99 )
------------------------------------------------------------
#Fit statistic : Chi-Squared =          66.39 using 59 PHA bins.
# Reduced chi-squared =          1.207 for     55 degrees of freedom
# Null hypothesis probability =   1.398169e-01

Photon flux (15-150 keV)    in 1 sec:  (    ) ph/cm2/s
Energy fluence (15-150 keV)             : 0 ( 0  0 ) ergs/cm2
Single BB
Spectral model blackbody:
------------------------------------------------------------
Parameters  : value    Lower 90%  Upper 90%
kT [keV]    : 10.8427  (-1.59828  1.86606)
R^2/D10^2   : 0.342825  (-0.15362   0.275976)
(R is the radius in km and D10 is the distance to the source in units of 10 kpc)
------------------------------------------------------------
#Fit statistic : Chi-Squared =          71.43 using 59 PHA bins.
# Reduced chi-squared =          1.253 for     57 degrees of freedom
# Null hypothesis probability =   9.461776e-02

Energy  Fluence     90% Error
[keV]   [erg/cm2]   [erg/cm2]
15- 25  8.396e-09   2.108e-09
25- 50  2.330e-08   4.765e-09
50-150  1.530e-08   5.760e-09
15-150  4.700e-08   9.730e-09
Thermal bremsstrahlung (OTTB)
Spectral model: thermal bremsstrahlung
------------------------------------------------------------
Parameters  : value         Lower 90%    Upper 90%
kT [keV]    : 91.2552       (-34.5039      84.4589)
Norm        : 4.28036       (-0.78024     0.992453)
------------------------------------------------------------
#Fit statistic : Chi-Squared =          69.19 using 59 PHA bins.
# Reduced chi-squared =          1.214 for     57 degrees of freedom
# Null hypothesis probability =   1.291685e-01

Energy  Fluence     90% Error
[keV]   [erg/cm2]   [erg/cm2]
15- 25  1.117e-08   2.309e-09
25- 50  1.895e-08   3.755e-09
50-150  2.911e-08   1.607e-08
15-150  5.924e-08   1.863e-08
Double BB
------------------------------------------------------------
Parameters  : value         Lower 90%    Upper 90%
kT1 [keV]   : 198.415        (      )
R1^2/D10^2  : 6.66449E-05        (-4.61995e-05      0.297377)
kT2 [keV]   : 9.65762        (-1.57881      1.8606)
R2^2/D10^2  : 0.491011    (-0.225247   4.60932)
------------------------------------------------------------
#Fit statistic : Chi-Squared =          67.21 using 59 PHA bins.
#Fit statistic : Chi-Squared =          67.20 using 59 PHA bins.
# Reduced chi-squared =          1.222 for     55 degrees of freedom
# Reduced chi-squared =          1.222 for     55 degrees of freedom
# Null hypothesis probability =   1.250707e-01
# Null hypothesis probability =   1.252481e-01

Energy  Fluence     90% Error
[keV]   [erg/cm2]   [erg/cm2]
15- 25  1.040e-08   6.295e-09
25- 50  2.054e-08   1.075e-08
50-150  2.336e-08   1.402e-08
15-150  5.430e-08   2.885e-08
Plot creation:
Fri May 16 12:50:21 EDT 2014