batgrbproduct Analysis for Trigger=355942
Analysis Summary
Notes:
- 1) No attempt has been made to eliminate the non-significant decimal places.
- 2) This batgrbproduct analysis is done of the amount of data for this trigger downloaded to date.
- 3) This page will be updated for up to 8 downlinks after the trigger.
======================================================================
                  BAT GRB EVENT DATA PROCESSING REPORT
    Process Script Ver: batgrbproduct v2.45
    Process Start Time (local time): Mon Jun 29 02:30:37 EDT 2009
             Host Name: gcn5
   Current Working Dir: /local/data/raid16/prebascript_archive/trigger355942/GCN5_download_cron
======================================================================

  Trigger: 00355942      Segment: 000

  BAT Trigger Time: 267916816.896   [s; MET]
      Trigger Stop: 267916817.92   [s; MET]
               UTC: 2009-06-28T21:20:12.029720    [includes UTCF correction]
       Where From?: TDRSS position message

  BAT
    RA: 237.049710631592   Dec: -15.9769445036211  [deg; J2000]

     Catalogged Source?: NO
     Point Source?:      YES
     GRB Indicated?:     YES    [ by BAT flight software ]
     Image S/N Ratio:    10.03
     Image Trigger?:     NO
     Rate S/N Ratio:     15.3622914957372  [ if not an image trigger ]
     Image S/N Ratio:    10.03

  Flight Position:   [ source = BAT ]
    RA: 237.049710631592   Dec: -15.9769445036211  [deg; J2000]

  Ground Position:   [ source = BAT pre-slew burst ]
    RA: 237.037508791526   Dec: -15.9691568836679  [deg; J2000]
        { 15h 48m 09.0s , -15d 58' 09.0" }
         +/- 1.70955149733464 [arcmin] (estimated 90% radius based on SNR)
         +/- 0.755266545523196 [arcmin] (formal 1-sigma fit error)
    SNR: 14.1393531068066

  Angular difference between Flight and Ground position is 0.844823 arcmin

  Partial Coding Fraction: 0.6328125    [ including projection effects ]

  Duration
     T90: 20.0999999940395 +/- 4.60215296540474
        Measured from: -16.6879999041557
                   to: 3.4120000898838     [s; relative to TRIGTIME]
     T50: 11.1400000154972 +/- 3.77595128336567
        Measured from: -9.65999990701675
                   to: 1.48000010848045     [s; relative to TRIGTIME]


  Fluence
     Peak Flux  (peak 1 second)
        Measured from: 0.0520000159740448
                   to: 1.05200001597404     [s; relative to TRIGTIME]
     Total Fluence
        Measured from: -25.0320000052452
                   to: 3.97600001096725     [s; relative to TRIGTIME]

             Band 1     Band 2     Band 3     Band 4
              15-25      25-50     50-100    100-350     keV
 Total     0.263730   0.335798   0.333315   0.116388
           0.040565   0.037840   0.032495   0.028136 [error]
 Peak      0.041021   0.068153   0.053838   0.009001
           0.007987   0.007901   0.007005   0.005711 [error]

     [ fluence units of on-axis counts / fully illuminated detector ]

======================================================================

=== Fluence/Peak Flux Summary ===

              Model    Band1    Band2    Band3    Band4    Band5    Total
                       15-25    25-50   50-100  100-350   15-150   15-350   keV
Fluence   Power-law 8.03e-08 1.61e-07 2.51e-07 8.64e-07 7.01e-07 1.36e-06   erg/cm2
              Error 1.69e-08 1.96e-08 3.27e-08 2.62e-07 8.04e-08 2.79e-07   erg/cm2
Peak flux Power-law 4.69e-01 4.90e-01 3.63e-01 4.33e-01 1.49e+00 1.75e+00   ph/cm2/s
              Error 1.07e-01 6.92e-02 5.79e-02 1.42e-01 1.97e-01 2.31e-01   ph/cm2/s

Fluence   Cutoff-PL 8.02e-08 1.61e-07 2.52e-07 8.58e-07 7.01e-07 1.29e-06   erg/cm2
              Error 1.69e-08 1.96e-08 3.27e-08 2.60e-07 8.04e-08 8.33e-07   erg/cm2
Peak flux Cutoff-PL 4.24e-01 5.17e-01 3.78e-01 2.31e-01 1.45e+00 1.55e+00   ph/cm2/s
              Error 1.25e-01 8.26e-02 6.53e-02 2.25e-01 2.04e-01 3.61e-01   ph/cm2/s

Fluence        Band 0.00e+00 0.00e+00 0.00e+00 0.00e+00 0.00e+00 0.00e+00   erg/cm2
              Error 0.00e+00 0.00e+00 0.00e+00 0.00e+00 0.00e+00 0.00e+00   erg/cm2
Peak flux      Band 0.00e+00 0.00e+00 0.00e+00 0.00e+00 0.00e+00 0.00e+00   ph/cm2/s
              Error 0.00e+00 0.00e+00 0.00e+00 0.00e+00 0.00e+00 0.00e+00   ph/cm2/s
=== Time-averaged spectral analysis ===

Model Ph_index Ph_90err Epeak  Epeak_90err Norm     Nomr_90err chi2   dof
PL    1.358    0.200    -      -           2.48e-03 2.60e-04   48.200 57
CPL   1.362    0.202    9999.4    0.0      2.49e-03 8.04e-04   48.220 56


=== 1-s peak spectral analysis ===

Model Ph_index Ph_90err Epeak  Epeak_90err Norm     Nomr_90err chi2   dof
PL    1.436    0.222    -      -           1.21e-02 1.58e-03   41.570 57
CPL   0.865    0.887      99.1  -30.7      2.36e-02 3.26e-02   40.280 56

Model      : spectral model: simple power-law (PL) and cutoff power-law (CPL)
Ph_index   : photon index: E^-{Ph_index} (minus sign is not included in the index)
Ph_90err   : 90% error of the photon index
Epeak      : Epeak in keV
Epeak_90err: 90% error of Epeak
Norm       : normalization at 50 keV in PL model and at 1 keV in CPL model
Nomr_90err : 90% error of the normalization
chi2       : Chi-Squared
dof        : degree of freedom
=== T90/T50 calculation in the 50-300 keV band (BATSE band) using 64 ms lc ===

T90 in the 50-300 keV band: 21.056000 sec.
T50 in the 50-300 keV band: 8.576000 sec.
=== Table of the duration information ==

        Value   tstart    tstop
T100   29.008  -25.032    3.976
T90    20.100  -16.688    3.412
T50    11.140   -9.660    1.480
Peak    1.000    0.052    1.052
Image
Pre-slew 15-350 keV image (Event data; bkg subtracted)
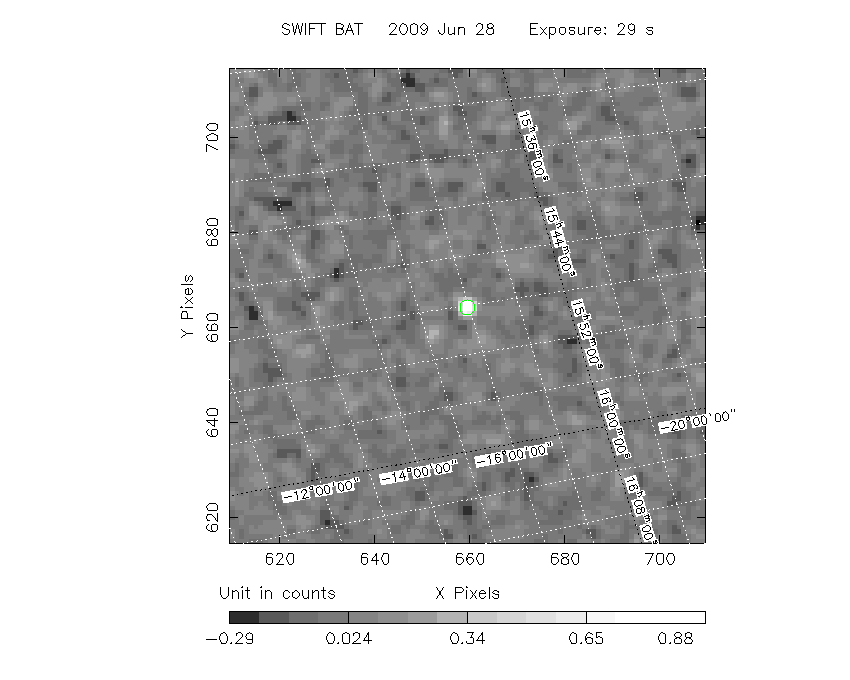
#   RAcent  DECcent POSerr  Theta    Phi     Peak Cts     SNR  Name
  237.0375 -15.9692 0.0136   31.3  -40.4       1.0800    14.1  TRIG_00355942
------------------------------------------

Foreground time interval of the image:
-25.032   3.976 (delta_t =  29.008 [sec])
Background time interval of the image:
-239.896 -25.032 (delta_t = 214.864 [sec])
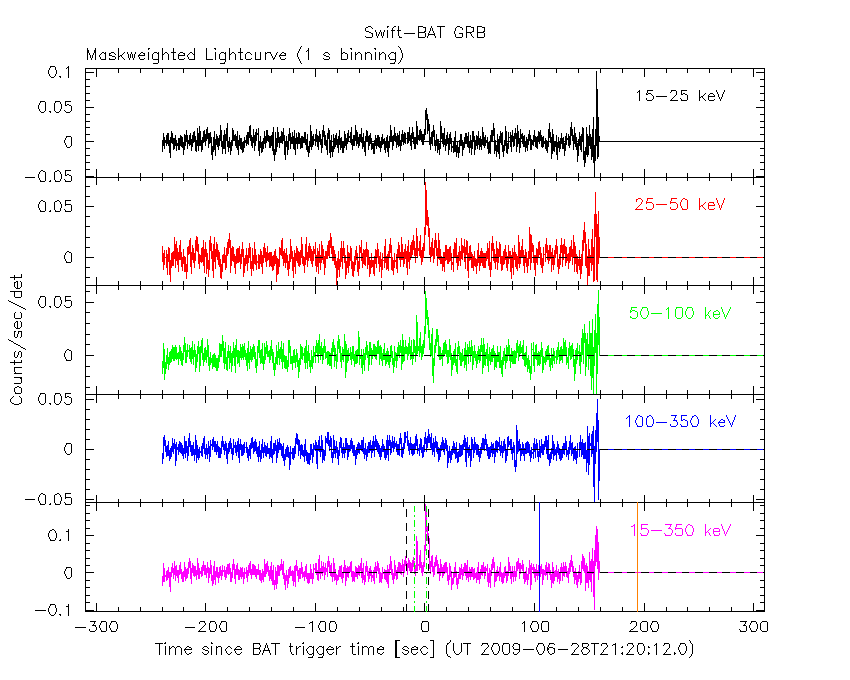
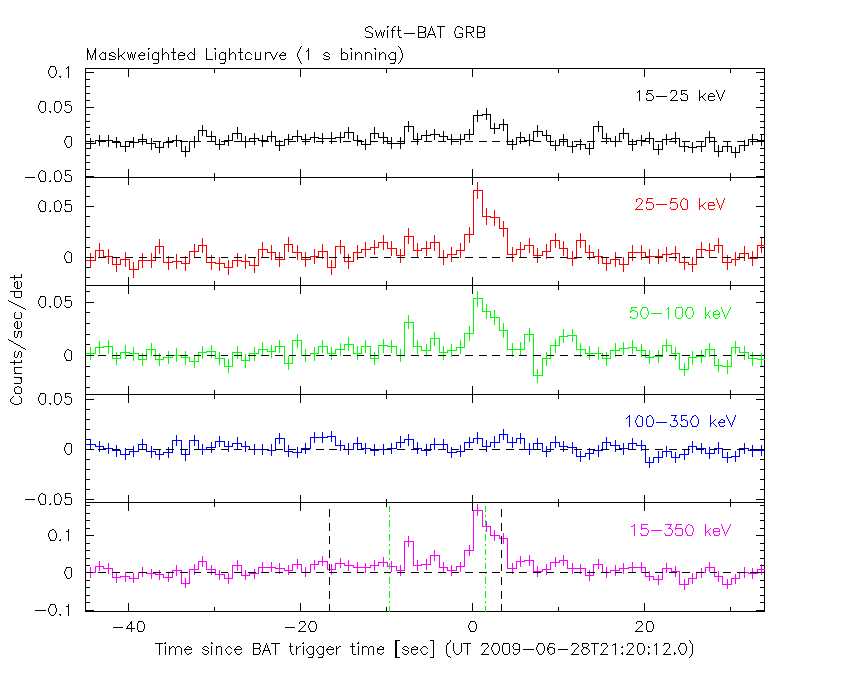
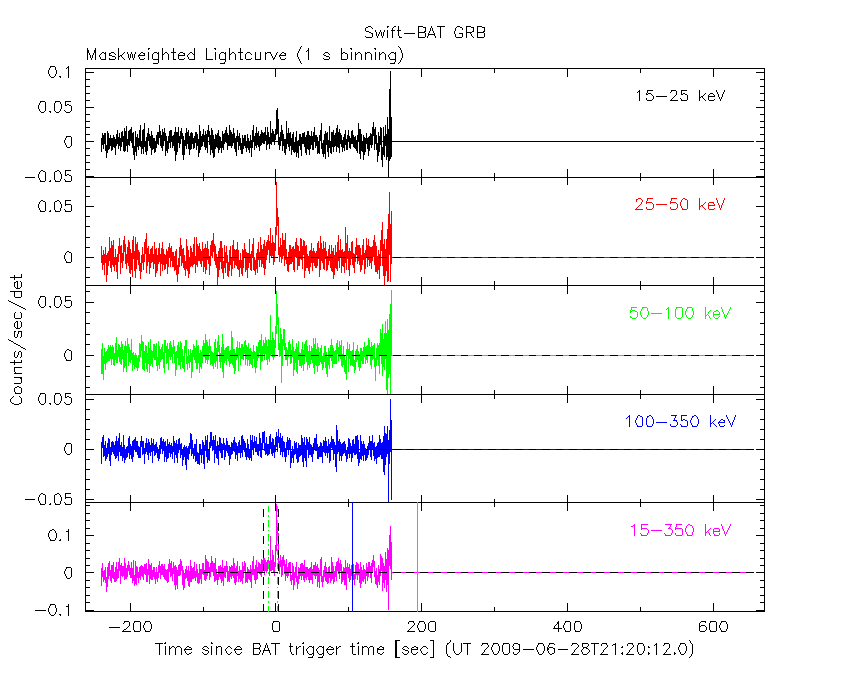
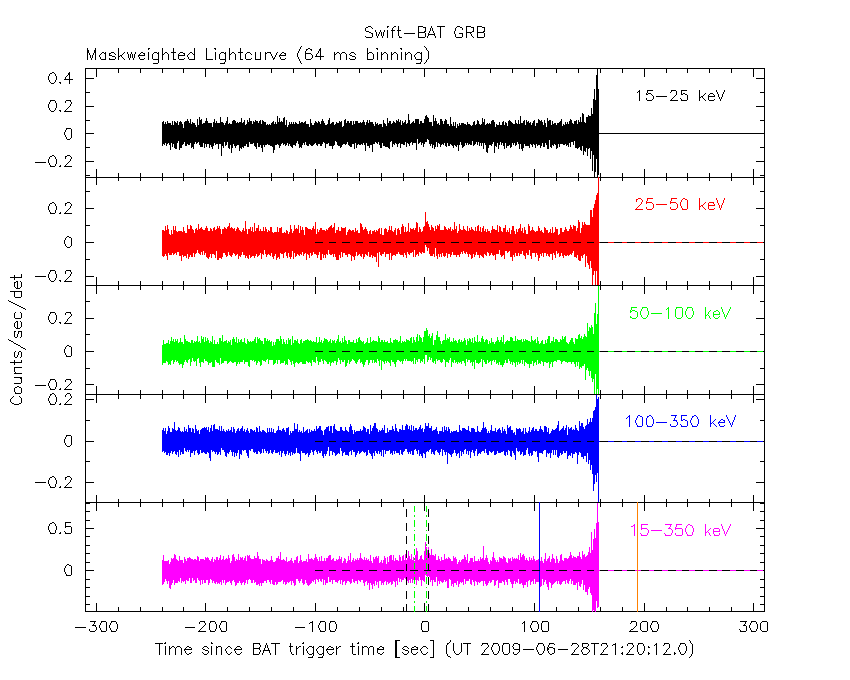
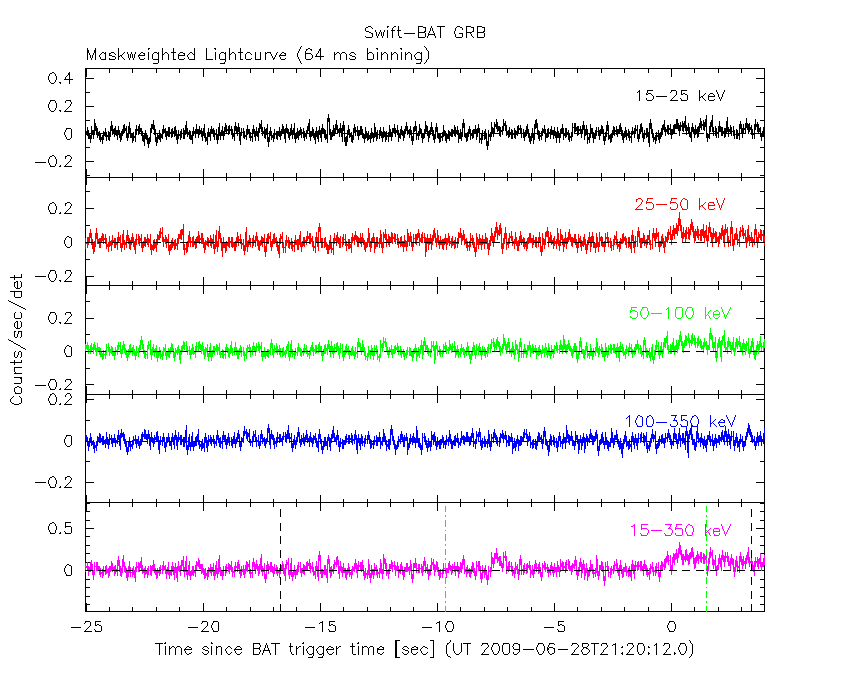
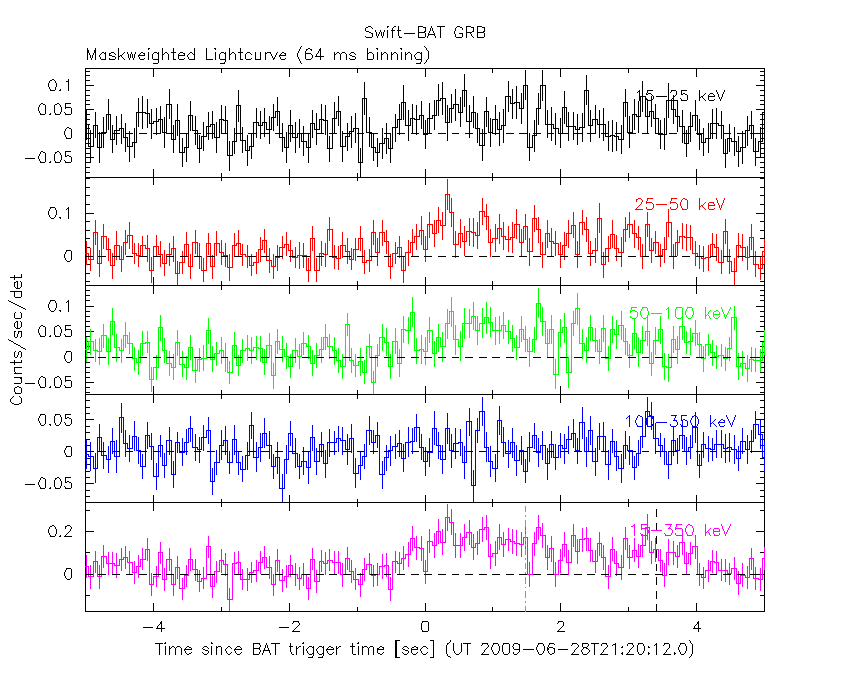
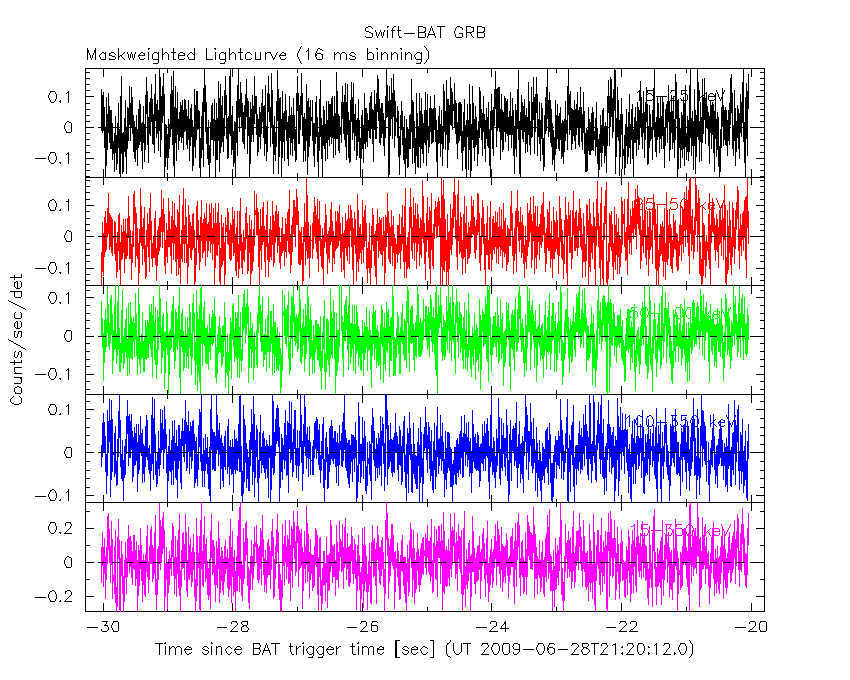
Lightcurves
Notes:
- 1) All plots contain as much data as has been downloaded to date.
- 2) Multiple plots of different time binning/intervals are shown to cover all scenarios of short/long GRBs, rate/image triggers, and real/false positives.
- 3) For all the mask-weighted lightcurves, the y-axis units are counts/sec/det where a det is 0.4 x 0.4 = 0.16 sq cm.
- 4) The verticle lines correspond to following: green dotted lines are T50 interval, black dotted lines are T90 interval, blue solid line(s) is a spacecraft slew start time, and orange solid line(s) is a spacecraft slew end time.
- 5) Time of each bin is in the middle of the bin.
1 s binning
From T0-310 s to T0+310 s
From T100_start - 20 s to T100_end + 30 s
Full time interval
64 ms binning
Full time interval
From T100_start to T100_end
From T0-5 sec to T0+5 sec
16 ms binning
From T100_start-5 s to T100_start+5 s
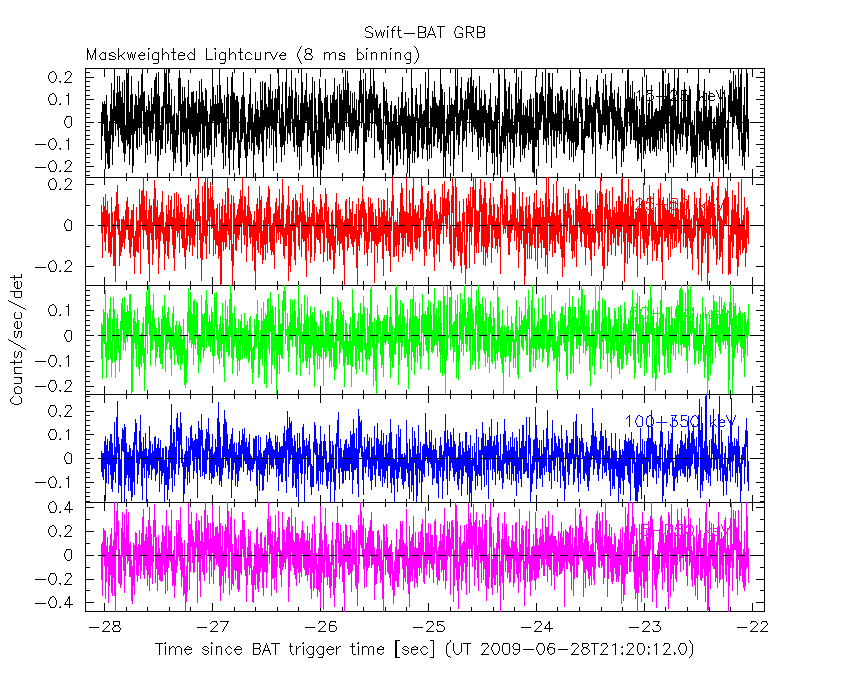
8 ms binning
From T100_start-3 s to T100_start+3 s
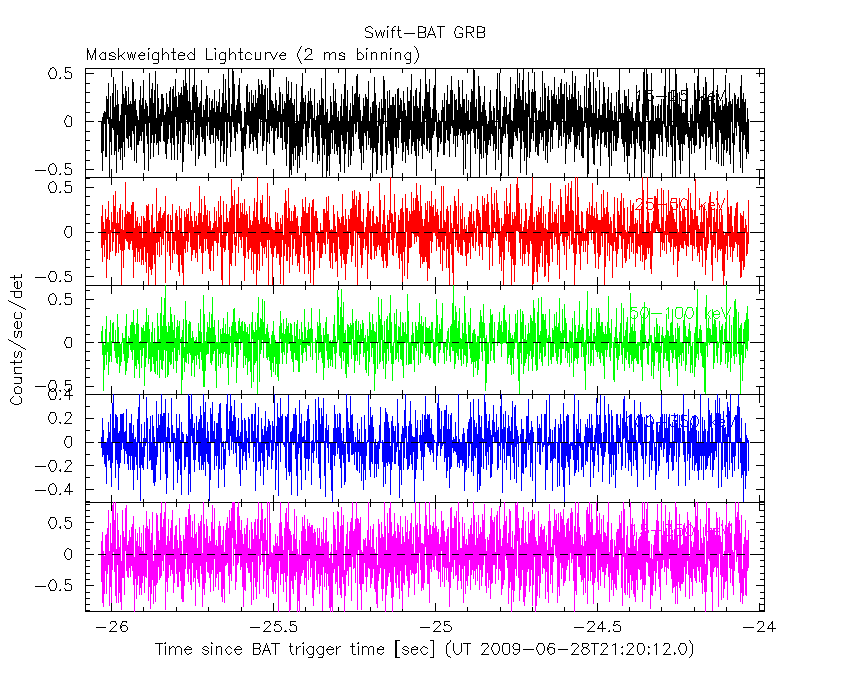
2 ms binning
From T100_start-1 s to T100_start+1 s
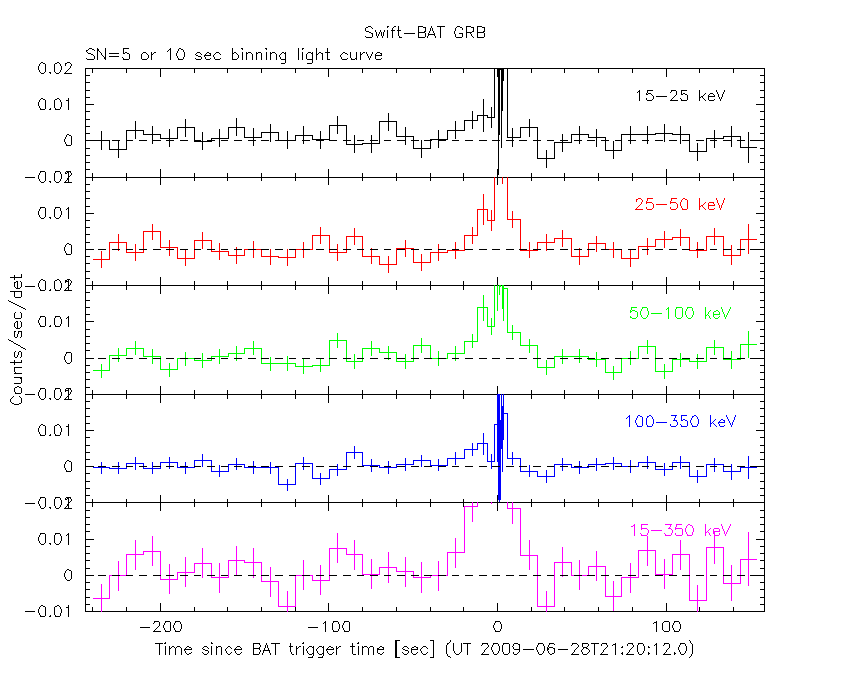
SN=5 or 10 sec. binning (whichever binning is satisfied first)
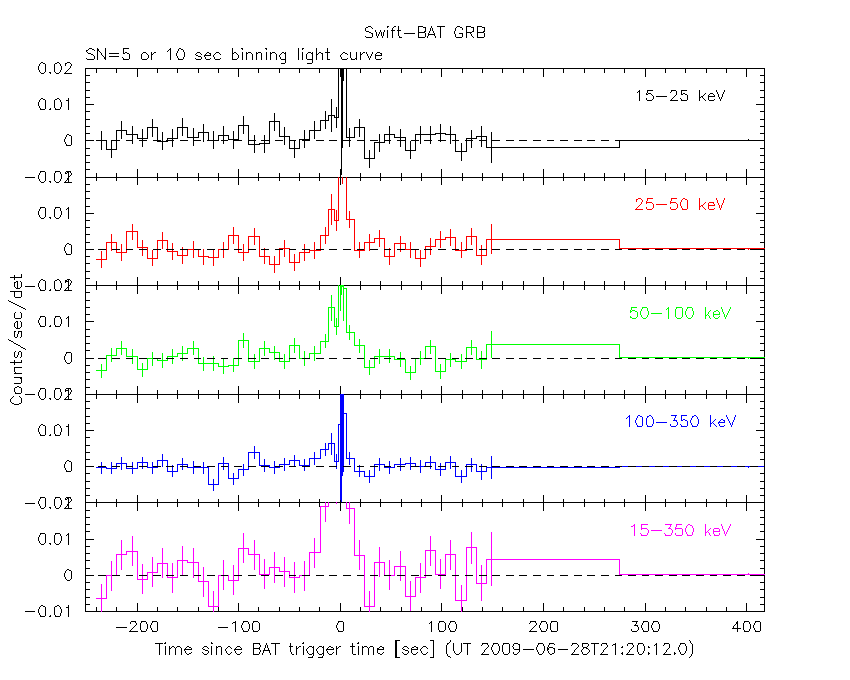
SN=5 or 10 sec. binning (T < 200 sec)
Spectra
Notes:
- 1) The fitting includes the systematic errors.
- 2) For long bursts, a spectral fit of the pre-slew DRM will introduce some errors in both a spectral shape and a normalization if the PHA file contains a lot of the slew/post-slew time interval.
- 3) For fits to more complicated models (e.g. a power-law over a cutoff power-law), the BAT team has decided to require a chi-square improvement of more than 6 for each extra dof.
- 4) For short bursts (T90<1sec), the specrtum is also fit with Blackbody, OTTB, and Double Blackbody.
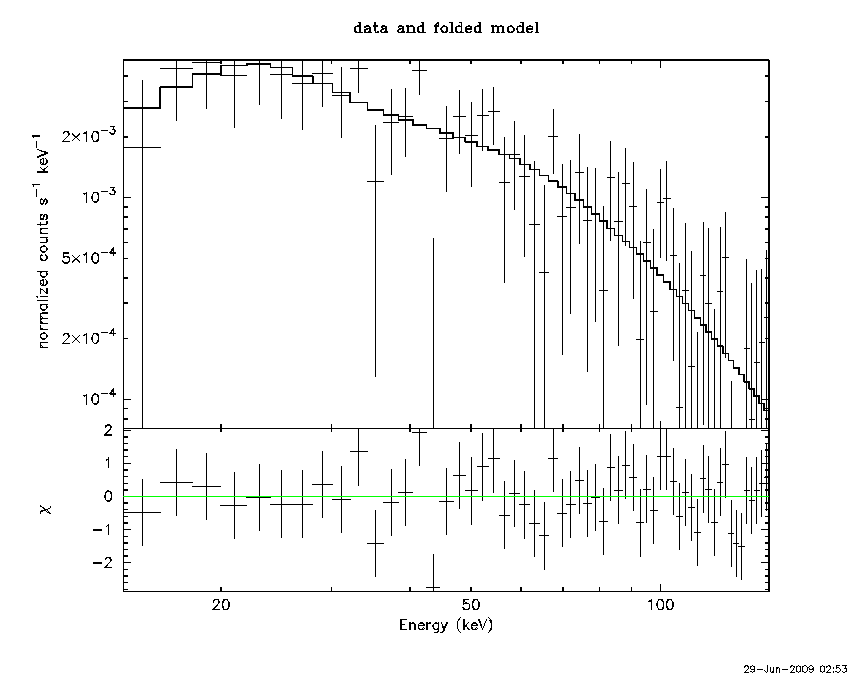
Time averaged spectrum fit using the pre-slew DRM
Power-law model
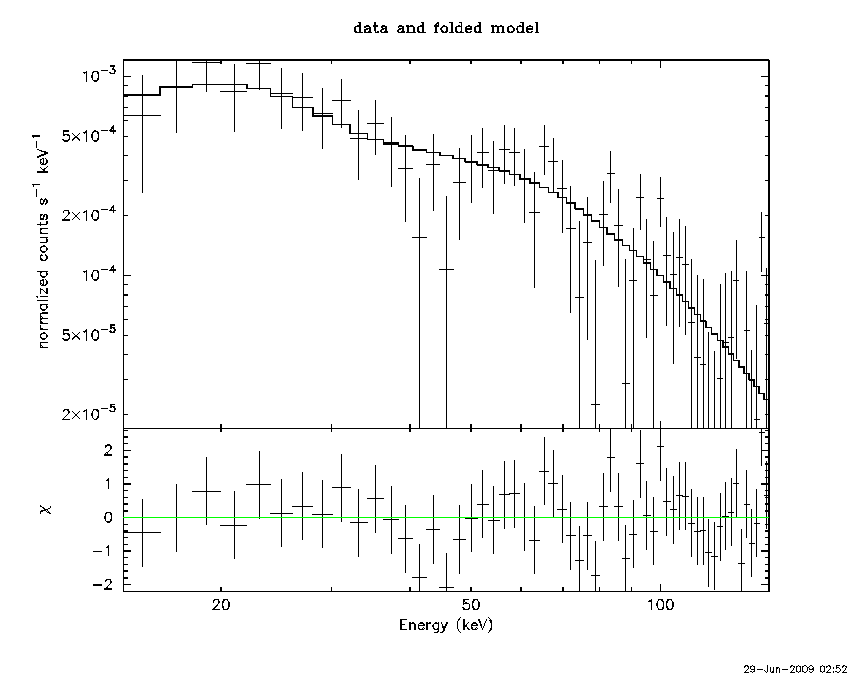
Time interval is from  -25.032 sec. to    3.976 sec.

Spectral model in power-law:
------------------------------------------------------------
Parameters  : value       lower 90%   higher 90%
Photon index: 1.35764     ( -0.201553   0.198852 )
Norm@50keV  : 2.47683E-03    ( -0.000259869   0.000259837 )
------------------------------------------------------------
# Chi-Squared =          48.20 using 59 PHA bins.
# Reduced chi-squared =         0.8456 for     57 degrees of freedom
# Null hypothesis probability =   7.903462e-01

Photon flux (15-150 keV)    in 29.01 sec: 0.298860 ( -0.0333601  0.0334983 ) ph/cm2/s
Energy fluence (15-150 keV)             : 7.00577e-07 ( -8.01349e-08  8.06725e-08 ) ergs/cm2
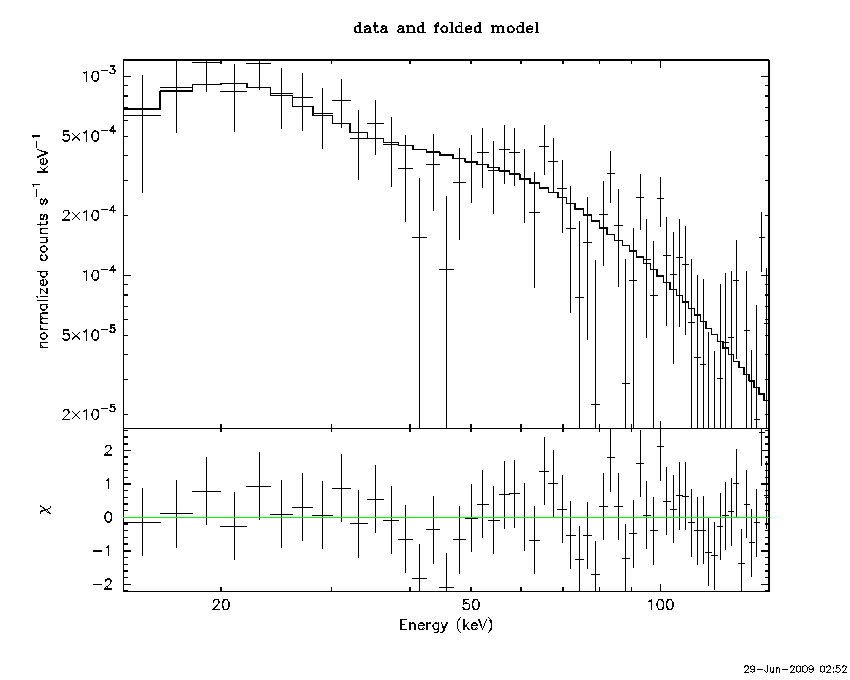
Cutoff power-law model

Time interval is from  -25.032 sec. to    3.976 sec.
Spectral model in the cutoff power-law:
------------------------------------------------------------
Parameters  : value       lower 90%   higher 90%
Photon index: 1.36180     ( -0.210068   0.193277 )
Epeak [keV] : 9999.36      ( -9998.48 -9998.48 )
Norm@50keV  : 2.48555E-03    ( -0.000260404   0.00134812 )
------------------------------------------------------------
# Chi-Squared =          48.22 using 59 PHA bins.
# Reduced chi-squared =         0.8611 for     56 degrees of freedom
# Null hypothesis probability =   7.606653e-01

Photon flux (15-150 keV)    in 29.01 sec: 0.298729 ( -0.033347  0.033487 ) ph/cm2/s
Energy fluence (15-150 keV)             : 7.00652e-07 ( -8.01662e-08  8.07029e-08 ) ergs/cm2
Band function
Time interval is from  -25.032 sec. to    3.976 sec.

Spectral model in the Band function:
------------------------------------------------------------
Parameters  : value       lower 90%   higher 90%
alpha       : 4.91837   ( -25.3827   -25.3827 )
beta        : -1.36978    ( -0.115756   0.202339 )
Epeak [keV] : 21.6882      ( -21.5491 7.61672 )
Norm@50keV   : 465.422    ( -491.308   1466.28 )
------------------------------------------------------------
# Chi-Squared =          48.06 using 59 PHA bins.
# Reduced chi-squared =         0.8739 for     55 degrees of freedom
# Null hypothesis probability =   7.346979e-01

Photon flux (15-150 keV)    in 29.01 sec:  (    ) ph/cm2/s
Energy fluence (15-150 keV)             : 0 ( 0  0 ) ergs/cm2
Peak spectrum fit using the pre-slew DRM
Power-law model
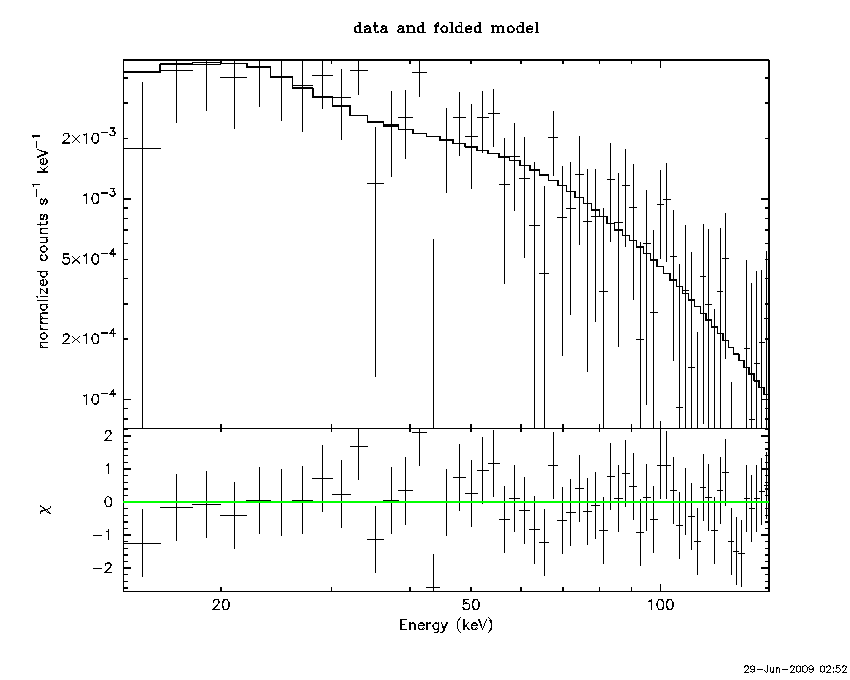
Time interval is from    0.052 sec. to    1.052 sec.

Spectral model in power-law:
------------------------------------------------------------
Parameters  : value       lower 90%   higher 90%
Photon index: 1.43562     ( -0.22165   0.221846 )
Norm@50keV  : 1.21196E-02    ( -0.00158516   0.00157965 )
------------------------------------------------------------
# Chi-Squared =          41.57 using 59 PHA bins.
# Reduced chi-squared =         0.7292 for     57 degrees of freedom
# Null hypothesis probability =   9.379053e-01

Photon flux (15-150 keV)    in 1 sec: 1.48832 ( -0.19658  0.197079 ) ph/cm2/s
Energy fluence (15-150 keV)             : 1.16289e-07 ( -1.6598e-08  1.67967e-08 ) ergs/cm2
Cutoff power-law model
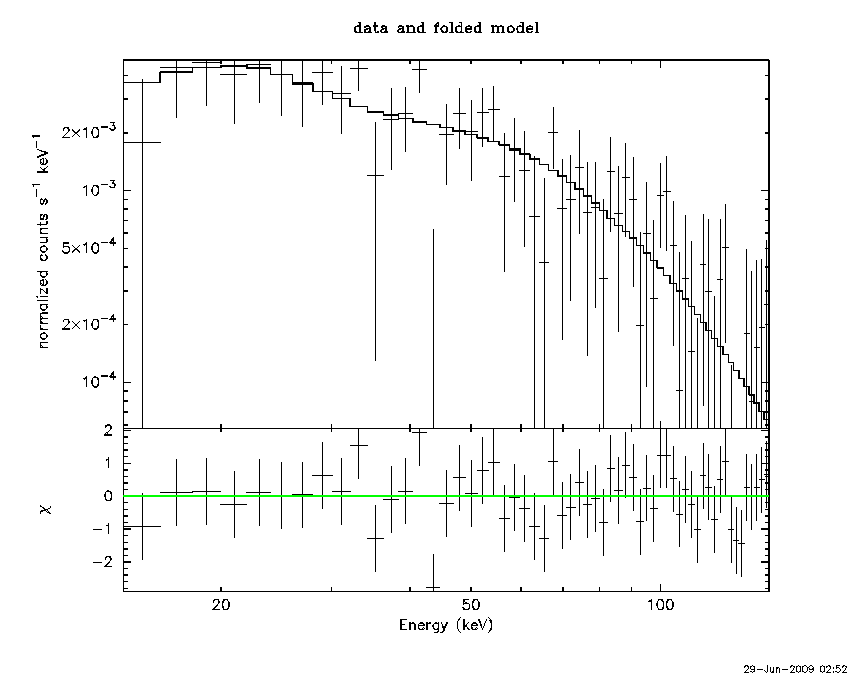
Time interval is from    0.052 sec. to    1.052 sec.
Spectral model in the cutoff power-law:
------------------------------------------------------------
Parameters  : value       lower 90%   higher 90%
Photon index: 0.864908     ( -1.05054   0.72407 )
Epeak [keV] : 99.0541      ( -37.7527 -99.0542 )
Norm@50keV  : 2.35971E-02    ( -0.01   0.0552137 )
------------------------------------------------------------
# Chi-Squared =          40.28 using 59 PHA bins.
# Reduced chi-squared =         0.7193 for     56 degrees of freedom
# Null hypothesis probability =   9.438494e-01

Photon flux (15-150 keV)    in 1 sec: 1.45185 ( -0.20429  0.20424 ) ph/cm2/s
Energy fluence (15-150 keV)             : 1.11217e-07 ( -1.85579e-08  1.8531e-08 ) ergs/cm2
Band function
Time interval is from    0.052 sec. to    1.052 sec.

Spectral model in the Band function:
------------------------------------------------------------
Parameters  : value       lower 90%   higher 90%
alpha       : 2.04662   ( -4.57272   -4.57272 )
beta        : -1.63896    ( -0.40534   0.324182 )
Epeak [keV] : 35.2532      ( -35.2532 139.666 )
Norm@50keV   : 2.60590    ( -2.43037   170.791 )
------------------------------------------------------------
# Chi-Squared =          39.32 using 59 PHA bins.
# Reduced chi-squared =         0.7149 for     55 degrees of freedom
# Null hypothesis probability =   9.453461e-01

Photon flux (15-150 keV)    in 1 sec:  (    ) ph/cm2/s
Energy fluence (15-150 keV)             : 0 ( 0  0 ) ergs/cm2
Plot creation:
Mon Jun 29 02:55:14 EDT 2009