TABLE OF CONTENTS:
The GCN system started out as the BACODINE system, where BACODINE was an acronym: BAtse COordinaes DIstribution NEtwork.
About 2 times a day, there the BATSE instrument will trigger on a count-rate increase. The BACODINE system (back then) analysiszes these increases and calcualtes a direction. If that position meets the site's filtering criteria, then it gets that Notice.
There are 5 different types of of information from the CGRO mission.
which types are suitable for their specific operation:
Original
This is the original form of GRB locations distributed to the then BACODINE sites.
(Now this, as are all the other notice types, is distributed to the GCN sites.)
The positions in these location notices are derived using the "ideal physics"
response functions for the LADs
and therefore have the largest location uncertainties. However, they are
also available to the follow-up community with the shortest time delays
from the start of the GRB -- typically less than 5 sec, which is shorter than
the duration of more than half the GRBs.
Click for more information on Original Coordinates Notices.
Final
Unlike the Original location which uses only
the first 1 or 2 seconds of data in the GRB, this Final location is based
on the integral of the light curve for up to 32 seconds of the GRB.
The Final Notices report the peak intensity and the fluence during the 32
seconds. These two parameters allow the user to assess the "importance"
of the burst.
With more counting statistics, there is slight improvement in the
location uncertainty (i.e. it is somewhat systematics dominated).
Click for more information on Final Coordinates Notices.
MAXBC
The MAXBC locations are derived from the 16 "Maximum Burst Channels" that
are determined by the on-board BATSE flight software. The 16 rates are
available to the GCN (BACODINE) system at T+10 minutes after the trigger. They
are useful for those situations when the initial GRB BATSE trigger happened
within a telemetry gap, making the generation of the Original Notice
impossible.
The location uncertainty is comparable to the Original locations.
Click for more information on MAXBC Coordinates Notices.
Locburst
This source of GRB location information improves the location uncertainty
by a factor of 2-5x over the Original and MAXBC locations. It uses the
LOCBURST algorithm developed by the BATSE team at MSFC.
The GCN (BACODINE) system
captures the BATSE telemetry data during a GRB, automatically ftp's it to
MSFC, pages an "on call" person, who then applies the Locburst algorithm
plus the advantages of a human-in-the-loop for data better selection,
calculates a location, sends it back to the GCN (BACODINE) system.
The GCN (BACODINE) system monitors for these incoming Locburst locations and
distributes them. This whole process takes only 15-35 minutes!
Click for more information on LOCBURST Coordinates Notices.
MSFC Admin
These reports come out 1-3 days after the burst. They are based on the
full data set(s) availalble, with the cleanest data chosen, and have the
smallest error boxes (of the BATSE-derived Notices). These are the best
BATSE-derived locations available until the periodic BATSE Burst Catalog
is issued. These GRB locations are not distributed via the normal distribution
methods. They are available only in the GRB Locations
Web Page Table.
Light Curves
The GCN program produces several forms of light curve information for
the BATSE triggers (GRBs and non-GRBs alike).
Currently, these light curves are only available through the
GRB Web Page Table.
There is a column that has links to the various forms and formats
of the light curves:
(1) there are the planewave light curves in the 4 DISCLA energy windows
and the IPN light curve in the 20-100 keV window, and (2) the formats
are ascii text, postscript, and soon jpeg.
Soon, GCN will also have the ability
to e-mail the text and postscript forms of the light curves directly to those
sites that request this form of information.
COMPTEL
The COMPTEL instrument also on CGRO also can localize GRB -- particularly
the brighter GRBs and those with harder spectrums.
Click for a description
of the CGRO-COMPTEL GRB location notices.
And click to see the Table of COMPTEL Locations.
2.1) Details of the BATSE-derived portion (BACODINE):
To increase the probability that Gamma-Ray Burst (GRB) counterparts can be detected, we have built a system of hardware and software that calculates positions of GRBs detected by the BATSE instrument on CGRO and distributes those coordinates to instruments around the world within a time short enough that most GRBs are still bursting. The system is called the BATSE COordinates DIstribution NEtwork (BACODINE). It became possible to do this because of the failure of the on-board CGRO tape recorders. All the data from CGRO is transmitted to ground in real-time instead of delayed transmission from the tape recorder playback.
BATSE detects ~0.8 GRBs per day. Folding in multiplicative factors for the fraction of the sky that any ground-based instrument can see (0.35), the fraction when it is night (0.50, for the IR to UV band passes and 1.0 for some radio and TeV bandpasses), the fraction of clear-sky weather (0.75), and the "program efficiency" (0.60, see discussion below); the rate of making follow-up observations is 0.063 GRBs per day or once every 16 nights. [If factors for New Moon (0.50), for the brightest GRBs (0.50), and for the longest GRBs (0.50) are included; then the rate is 0.007 per day or once every 4 months for optical instruments and 1 month for radio.]
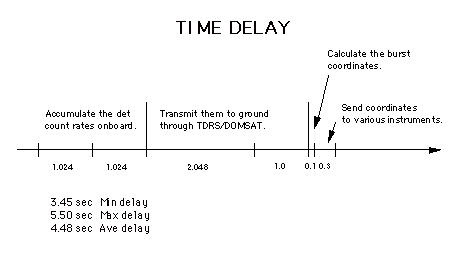
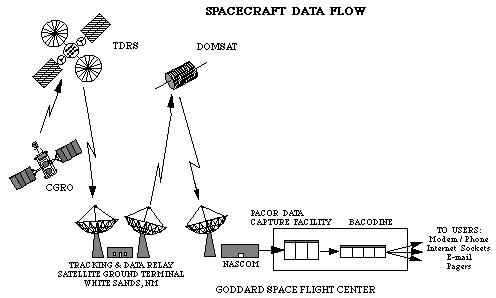
BATSE has two types of data from the 8 Large Area Detectors (LAD). The high time/spectral resolution data are buffered on-board the spacecraft for delayed transmission to the ground, but there is also 1.024-sec rough spectral resolution data which are transmitted continuously in real time. Figure 1 is a timeline of the sequence of steps in the flow of this real-time data from BATSE to the GCN (BACODINE) processing system. The count rates for the 8 LADs in 4 energy intervals are accumulated for two 1.024-sec intervals and then transmitted to a TDRS satellite over the next 2.048 seconds. The next two 1.024-sec counting rate samples are accumulated while the transmission of the previous 2 samples is in progress, and this process repeats continuously. For those portions of the orbit (85%) where CGRO can get direct line-of-sight transmission of its high-gain antenna to any of the three TDRS satellites, the data are relayed to the NASA White Sands Ground Station in New Mexico where they are retransmitted to DOMSAT and then transmitted back down to the Goddard Space Flight Center Data Capture Facility (see Figure 2). There is an additional 1.0 seconds of delay due to four hops of ground-to-geosync-orbit light-travel time and buffering within the White Sands facility. Once received at GSFC, the entire 2.048 sec of data is processed to yield GRB coordinates within 0.1 sec. The fastest method of coordinates distribution (see Table 1) takes an additional 0.3 seconds. If the GRB started at the beginning of the first 1.024-sec count-rate sample, then the total time delay between when the gamma rays interacted with the BATSE LADs and when the coordinates are available at an instrument to make follow-up observations is 5.50 seconds. If the GRB started at the end of the second 1.024-sec sample, then the time delay is 3.45 seconds. More than half of the GRBs are longer than 5.5 seconds, thus allowing follow-up observations to be made while the burst is still occurring. (See the distribution of GRB durations.)
While there are several programs running on several computers to do the processing of the BATSE data, the sequence of processing can be broken down into five basic steps. (1) A program monitors the telemetry stream continuously extracting the count-rates for the 8 LADs in the 4 energy intervals (25-50, 50-100, 100-300, >300 keV). It uses these rates to determine the current background rates. It also extracts some general purpose housekeeping information (spacecraft clock, RA,Dec orientation of the SC, etc). (2) It monitors the "burst-in-progress" flag generated by the BATSE flight processor and when set true, it (3) takes the current count rates, subtracts the previously accumulated background rates to get the source-only rates, finds the 3 brightest detectors, and (4) solves the set of 3 simultaneous equations of the dot-product of the unknown burst direction and the detector normals of the 3 bright detectors. (5) The burst direction is then sent to a list of instruments that are capable of making follow-up observations.
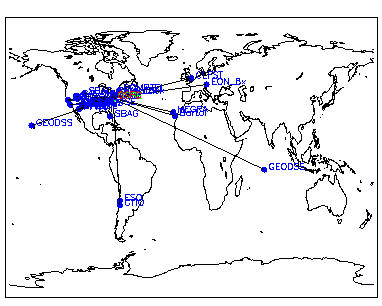
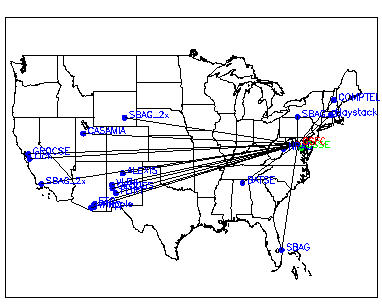
The distribution of GCN sites (as of ~1995) is shown the two figures (a world map and a US map).
Currently, the algorithm used to calculate the GRB direction for the BATSE Original, Final, and MAXBC Notices assumes "ideal response" physics for the LADs. This means (1) that the count rates in the LADs are proportional to the cosine of the angle between the detector normal vector and the GRB direction vector, and (2) that there is no distortion of the count rates in each detector due to detection of gamma rays scattered the the Earth's atmosphere or from the spacecraft. These two approximations yields an uncertainty for the BATSE (Original/Final/MAXBC) burst position of about a 20 deg diameter error circle (typical worst case).
Original Notices:
Currently, the algorithm used to calculate the GRB direction assumes "ideal response" physics for the LADs (i.e. no correction for non-cos(theta) and earth scattering). And since only the first 1.024 or 2.048 second samples of the light curve rates are used to calculate the location, the error in the Original locations is generally dominated by counting statistics (not systematics). Table 2 shows the radii of circles which contain the Original location from the location calculated by the BATSE instrument team. They have the luxury of time, cpu power, better deconvolution algorithms, and human brains in the loop to (1) select good data sets, (2) to select clean backgrounds, (3) calculate positions. As the "initial intensity" of the burst increases the error decreases. Two different error radii are given, one describes the circle that contains 68% of the locations and one for 90% containment. Click here for a plain text version of Table 2.
Also, listed in the table are the rate of occurence of triggers versus intensity. These are the GRB occurance rates (as a function of initial intensity) that GCN is able to calculate a location solution (i.e. the "program efficiency"). To calculate the rate that a given site is notified, these rates must be multiplied by the appropriate efficiency factors of the site's selected filters.
TABLE 2: GCN/BATSE LOCATION ACCURACY for the Original and MAXBC Notices Initial Intensity
[cnts]Error(90%)
[deg]Error(68%)
[deg]Occurance Rate
[num/mo]1000 24 12 8.6 2000 18 9 4.8 3000 14 7 2.9 4000 12 6 2.0 5000 n/a n/a 1.1 10000 n/a n/a 0.2
Final Notices:
With more counting statistics than the Original Notices due to integrating the light curve beyond the first 1-2 sec up to a total of 32 seconds, there is slight improvement in the location uncertainty (i.e. it is somewhat systematics dominated).
MAXBC Notices:
Again, the "ideal physics" detector response functions are used on the 16 MAXBC rate data, and the location uncertainty is essentially the same as for the above Original type of GRB location notices.
LOCBURST Notices:
In general, the location uncertainty
of these locations will be about 3x better than the Original/Final/MAXBC
Notices.
The statistical error will range from 0.1 to 2.0 deg (for the brightest
90% of the GRBs) plus a systematic error of 2 deg
(to be added in quadrature with the statistical).
The statistical error as a function of intensity is
shown in the following figure (M.Kippen,MSFC).
And the percentage of all LOCBURSTs that have a Total_error less than X-degrees is listed in the Table 2a.
TABLE 2a: FRACTION OF BURSTS vs TOTAL ERROR Fraction of
LOCBURSTsTotal 1-sigma Error
Radius Limit [deg]100% 5.4 90% 2.8 75% 2.3 50% 2.1
The Basic Rate: The BATSE instrument on the CGRO satellite triggers on about 2 "events" a day. Of those, ~0.8 are true astrophysical gamma ray bursts. The others are non-GRB caused triggers (e.g. electron precipitiation events, solar flares, TGFs, occultation emergances of strong sources, fluctuations in strong sources (Cyg X-1), SGRs, coincident phosphorescence, etc). It is an easy matter to determine your site's "observation" rate: any given site can see about 0.35 of the sky (assuming you can observe down to an elevation angle of 20 deg), the nighttime fraction is 0.5 (optical sites only), the clear sky (no clouds) fraction is about 0.75 (optical only), and the "program efficiency" is about 0.6. This yields a follow-up observation rate of 0.063/day (or once every 16 nights). (The program is not 100% efficient in calculating a position for all the BATSE triggers. There are numerous gaps in the telemetry which "confuse" the program in its determination of the proper background counting rate in the detectors to use in subtracting from the "burst" rate to get the true source-only rate.)
For radio sites there is no nighttime fraction and the clear sky (weather) fraction goes up to almost 1.0, so the resultant follow-up observation rate is about once every week.
Trigger Rate Time Dependence: In actual practice the BATSE trigger
rate changes with time for several reasons:
1) Trigger Criteria changes: In recent years the BATSE team has changed
the on-board triggering criteria to optimise the LADs to various different
types of sources (e.g. SGRs, TGFs, etc).
The MSFC team maintains a
table of the BATSE triggering criteria changes as a function of date, time,
and trigger number.
2) Source Changes: Various astrophysical sources come and go so the
events which trigger the BATSE instrument change (e.g. Solar Flares during
the solar cycle, J1744-28, etc).
3) Shorter Time Scales: On much shorter time scales than the above reasons
for causing changes in the triggering rate the precesion of the CGRO orbit
causes periodic increases in the orbital crossings of the SAA. When a
high percentage of the orbits cross the SAA and/or spend a longer
portion of the orbit in the SAA, the triggering rate increases due to the
increase (and variabiltiy) in the background rate.
Telemetry gaps cause a change in the "effective" trigger rate. For those events which have there initial trigger inside a telemetry gap, there are no BATSE-Original, -Final or -LOCBURST Notices. See a histogram of the telemetry gap duration times.